Introduction
Once an application is split into microservices, traffic usually needs a single entry point that can aggregate multiple backend services. In traditional environments, that role is often handled by Nginx, Apache, or HAProxy. Kubernetes has the same requirement, and the component that fills this role is the Ingress controller.
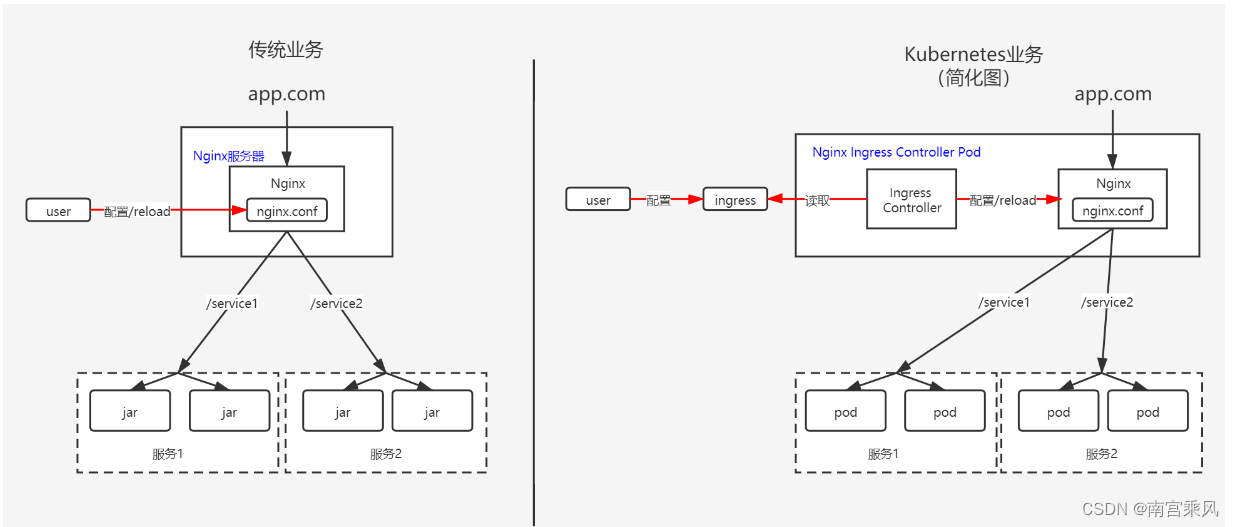
Two common Nginx-based choices are widely used:
Ingress-nginx uses the Nginx web server as its base and adds a set of Lua plugins for extra functionality. As the controller maintained by the Kubernetes community, it is often the default and most convenient option.
- GitHub: https://github.com/kubernetes/ingress-nginx
- Docs: https://kubernetes.github.io/ingress-nginx/deploy/
Nginx Ingress is developed by the official Nginx community. It is known for strong stability, ongoing backward compatibility, no third-party modules, and good performance partly because it avoids Lua.
- GitHub: https://github.com/nginxinc/kubernetes-ingress
- Docs: https://docs.nginx.com/nginx-ingress-controller/installation/installation-with-manifests/
Nginx Ingress Controller implements the Kubernetes Ingress API on top of Nginx. Nginx is already recognized as a high-performance gateway, but default settings do not automatically deliver the best results in production. Some parameter tuning is necessary if you want to make full use of its capabilities.

Tuning ingress-nginx in Kubernetes
A default ingress-nginx installation usually works, but it is not production-tuned out of the box. The main areas worth adjusting are:
- the
ingress-nginx-controllerPod - the controller
ConfigMap - Ingress rules used by business applications
A default deployment may look roughly like this, with no performance-oriented tuning applied:
<table> <thead> <tr> <th>1 2 3 4 5 6 7 8 9 10 11 12 13 14 15 16 17 18 19 20 21 22 23 24 25 26 27 28 29 30 31 32 33 34 35 36 37 38 39 40 41 42 43 44 45 46 47 48 49 50 51 52 53 54 55 56 57 58 59 60 61 62 63 64 65 66 67 68 69 70 71 72 73 74 75 76</th>
<th>kubectl get deployments.apps -n ingress-nginx ingress-nginx-controller # 整体就这个样子,但是没有任何优化,性能肯定欠缺 kubectl get deployments.apps -n ingress-nginx ingress-nginx-controller -o yaml apiVersion: apps/v1 kind: Deployment metadata: annotations: deployment.kubernetes.io/revision: "1" #暴露Prometheus 端口进行监控 prometheus.io/port: "10254" prometheus.io/scrape: "true" labels: app.kubernetes.io/component: controller app.kubernetes.io/instance: ingress-nginx app.kubernetes.io/managed-by: Helm app.kubernetes.io/name: ingress-nginx app.kubernetes.io/version: 1.0.0 helm.sh/chart: ingress-nginx-4.0.1 k8s.kuboard.cn/name: ingress-nginx-controller name: ingress-nginx-controller namespace: ingress-nginx resourceVersion: "91407609" uid: a5452fcf-f99c-4866-b0a1-93fe9e165cb6 spec: progressDeadlineSeconds: 600 replicas: 1 revisionHistoryLimit: 10 selector: matchLabels: app.kubernetes.io/component: controller app.kubernetes.io/instance: ingress-nginx app.kubernetes.io/name: ingress-nginx strategy: rollingUpdate: maxSurge: 25% maxUnavailable: 25% type: RollingUpdate template: metadata: labels: app.kubernetes.io/component: controller app.kubernetes.io/instance: ingress-nginx app.kubernetes.io/name: ingress-nginx spec: containers: - args: - /nginx-ingress-controller - --election-id=ingress-controller-leader - --controller-class=k8s.io/ingress-nginx - --configmap=$(POD_NAMESPACE)/ingress-nginx-controller - --validating-webhook=:8443 - --validating-webhook-certificate=/usr/local/certificates/cert - --validating-webhook-key=/usr/local/certificates/key - --watch-ingress-without-class=true env: - name: POD_NAME valueFrom: fieldRef: apiVersion: v1 fieldPath: metadata.name - name: POD_NAMESPACE valueFrom: fieldRef: apiVersion: v1 fieldPath: metadata.namespace - name: LD_PRELOAD value: /usr/local/lib/libmimalloc.so image: willdockerhub/ingress-nginx-controller:v1.0.0 imagePullPolicy: IfNotPresent lifecycle: preStop: exec: command: - /wait-shutdown ...........</th>
</tr>
</thead>
<tbody>
<tr>
<td></td>
<td></td>
</tr>
</tbody>
</table>
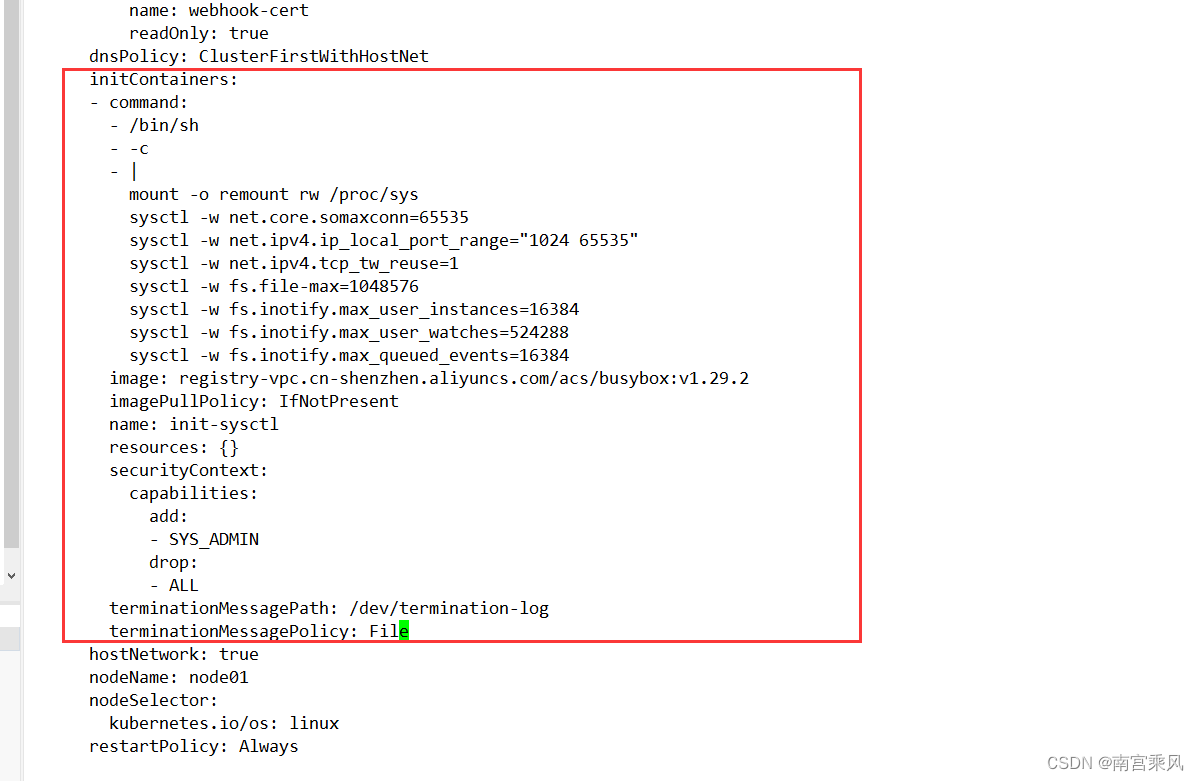
Initializing kernel parameters inside the Pod
A useful first step is tuning kernel parameters for the Pod that runs ingress-nginx. This can be done through an initContainer added under spec.template.spec.
1 2 3 4 5 6 7 8 9 10 11 12 13 14 15 16 17 18 19 20 21 22 23 24 25 26 27 28 29 30</th>
<th># 在 spec.template.spec 对象下添加一个初始化 initContainers 容器 initContainers: - command: - /bin/sh - -c - | mount -o remount rw /proc/sys sysctl -w net.core.somaxconn=65535 sysctl -w net.ipv4.ip_local_port_range="1024 65535" sysctl -w net.ipv4.tcp_tw_reuse=1 sysctl -w fs.file-max=1048576 sysctl -w fs.inotify.max_user_instances=16384 sysctl -w fs.inotify.max_user_watches=524288 sysctl -w fs.inotify.max_queued_events=16384 image: busybox:1.29.3 imagePullPolicy: IfNotPresent name: init-sysctl resources: {} securityContext: capabilities: add: - SYS_ADMIN drop: - ALL terminationMessagePath: /dev/termination-log terminationMessagePolicy: File #修改deployment kubectl edit deployments.apps -n ingress-nginx ingress-nginx-controller</th>
</tr>
</thead>
<tbody>
<tr>
<td></td>
<td></td>
</tr>
</tbody>
</table>
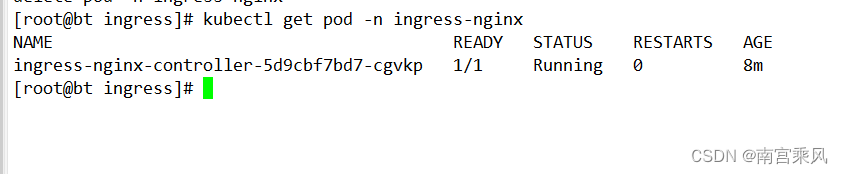
One operational detail matters here: if the installation follows the standard approach and the ingress workload is pinned to a specific node, scheduling can fail because the existing Pod is already occupying ports 80 and 443. In practice, the only workable approach is often:
- scale replicas down to
0 - modify the Deployment
- scale replicas back up to
1
So customization brings clear benefits, but it also introduces some deployment friction.
A common side effect of this kind of change is a large number of failed Pods caused by scheduling failures.
<table> <thead> <tr> <th>1 2</th>
<th>ingress-nginx-controller-5d9cbf7bd7-27q74 0/1 NodePorts 0 74s ingress-nginx-controller-5d9cbf7bd7-5lh9x 0/1 NodePorts 0 75s</th>
</tr>
</thead>
<tbody>
<tr>
<td></td>
<td></td>
</tr>
</tbody>
</table>

These failed Pods can be cleaned up in bulk:
<table> <thead> <tr> <th>1 2</th>
<th>批量清除(清除完成可能一直卡,需要自己看一下数量) kubectl get pods -n ingress-nginx -o custom-columns=NAME:.metadata.name,STATUS:.status.phase |grep "Failed" |awk '{print $1}' | xargs -r kubectl delete pod -n ingress-nginx</th>
</tr>
</thead>
<tbody>
<tr>
<td></td>
<td></td>
</tr>
</tbody>
</table>
ConfigMap optimization for Ingress
Another major tuning point is the controller ConfigMap. The controller arguments already show which ConfigMap it reads from:
1 2 3 4 5 6 7 8 9 10 11</th>
<th>spec: containers: - args: - /nginx-ingress-controller - --election-id=ingress-controller-leader - --controller-class=k8s.io/ingress-nginx - --configmap=$(POD_NAMESPACE)/ingress-nginx-controller - --validating-webhook=:8443 - --validating-webhook-certificate=/usr/local/certificates/cert - --validating-webhook-key=/usr/local/certificates/key - --watch-ingress-without-class=true</th>
</tr>
</thead>
<tbody>
<tr>
<td></td>
<td></td>
</tr>
</tbody>
</table>
That ingress-nginx-controller reference is the ConfigMap used for global Ingress behavior.
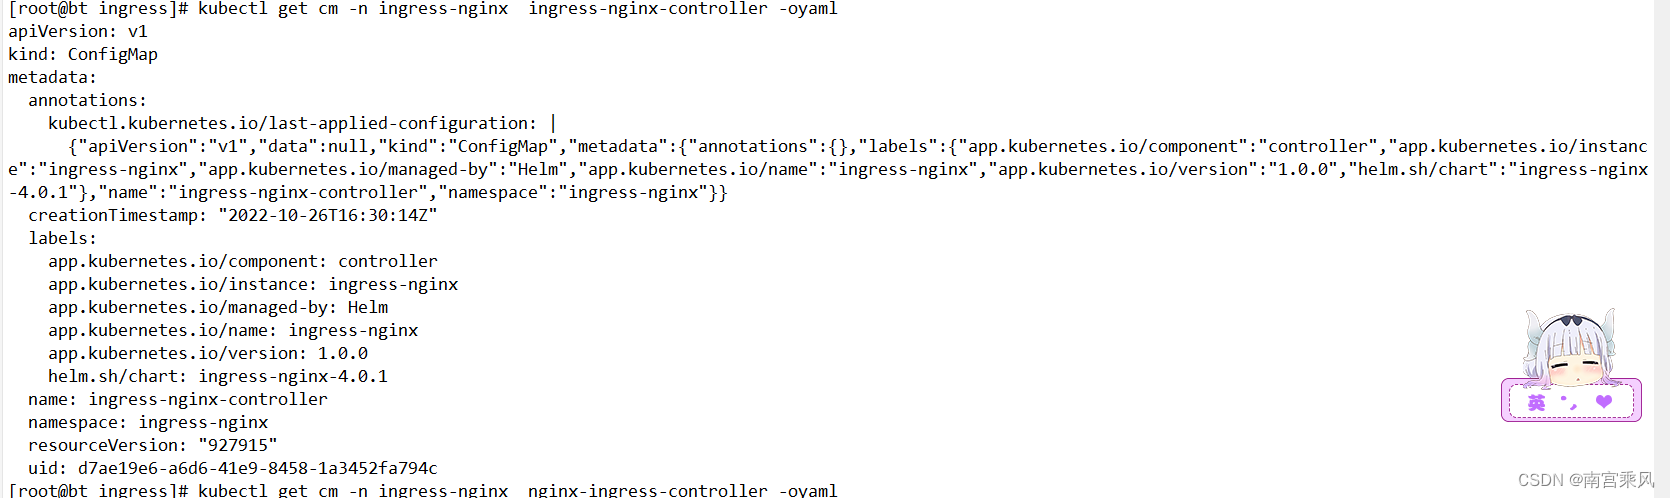
To inspect it:
<table> <thead> <tr> <th>1 2</th>
<th># 查看 Ingress-nginx 全局配置参数: kubectl get cm -n ingress-nginx ingress-nginx-controller -oyaml</th>
</tr>
</thead>
<tbody>
<tr>
<td></td>
<td></td>
</tr>
</tbody>
</table>
In a default installation, the data section may be empty.
The following example shows a richer data block. Some of these values can be adjusted further based on actual traffic patterns and application behavior.
A practical benefit here is that changes to the ingress-nginx ConfigMap can be applied through hot reload. In other words, once the ConfigMap is updated, the controller can detect the change and refresh its effective configuration without restarting Pods.
<table> <thead> <tr> <th>1 2 3 4 5 6 7 8 9 10 11 12 13 14 15 16 17 18 19 20 21 22 23 24 25 26 27 28 29 30 31 32 33 34 35 36 37 38 39 40</th>
<th>[root@bt ingress]# kubectl apply -f ingress-nginx-controller.yaml #热加载一下 [root@bt ingress]# cat ingress-nginx-controller.yaml apiVersion: v1 data: compute-full-forwarded-for: "true" forwarded-for-header: X-Forwarded-For log-format-upstream: '{"@timestamp":"$time_iso8601","time":"$time_local","remote_addr":"$remote_addr","http_x_forwarded_for":"$http_x_forwarded_for","remote_port":"$remote_port","remote_user":"$remote_user","host":"$host","upstream_addr":"$upstream_addr","upstream_status":"$upstream_status","upstream_response_time":$upstream_response_time,"upstream_cache_status":"$upstream_cache_status","request":"$request","status":"$status","request_time":$request_time,"body_bytes_sent":"$body_bytes_sent","http_referer":"$http_referer","http_user_agent":"$http_user_agent"}' proxy-body-size: 10g proxy-buffer-size: 256k proxy-connect-timeout: "90" proxy-read-timeout: "90" proxy-send-timeout: "90" use-forwarded-headers: "true" # 客户端请求头的缓冲区大小 client-header-buffer-size: "512k" # 设置用于读取大型客户端请求标头的最大值number和size缓冲区 large-client-header-buffers: "4 512k" # 读取客户端请求body的缓冲区大小 client-body-buffer-size: "128k" # 代理缓冲区大小 proxy-buffer-size: "256k" # 代理body大小 proxy-body-size: "50m" # 服务器名称哈希大小 server-name-hash-bucket-size: "128" # map哈希大小 map-hash-bucket-size: "128" # SSL加密套件 ssl-ciphers: "ECDHE-RSA-AES128-GCM-SHA256:ECDHE-ECDSA-AES128-GCM-SHA256:ECDHE-RSA-AES256-GCM-SHA384:ECDHE-ECDSA-AES256-GCM-SHA384:DHE-RSA-AES128-GCM-SHA256:DHE-DSS-AES128-GCM-SHA256:kEDH+AESGCM:ECDHE-RSA-AES128-SHA256:ECDHE-ECDSA-AES128-SHA256:ECDHE-RSA-AES128-SHA:ECDHE-ECDSA-AES128-SHA:ECDHE-RSA-AES256-SHA384:ECDHE-ECDSA-AES256-SHA384:ECDHE-RSA-AES256-SHA:ECDHE-ECDSA-AES256-SHA:DHE-RSA-AES128-SHA256:DHE-RSA-AES128-SHA:DHE-DSS-AES128-SHA256:DHE-RSA-AES256-SHA256:DHE-DSS-AES256-SHA:DHE-RSA-AES256-SHA:AES128-GCM-SHA256:AES256-GCM-SHA384:AES128-SHA256:AES256-SHA256:AES128-SHA:AES256-SHA:AES:CAMELLIA:DES-CBC3-SHA:!aNULL:!eNULL:!EXPORT:!DES:!RC4:!MD5:!PSK:!aECDH:!EDH-DSS-DES-CBC3-SHA:!EDH-RSA-DES-CBC3-SHA:!KRB5-DES-CBC3-SHA" # ssl 协议 ssl-protocols: "TLSv1 TLSv1.1 TLSv1.2" kind: ConfigMap metadata: labels: app: ingress-nginx name: ingress-nginx-controller namespace: ingress-nginx</th>
</tr>
</thead>
<tbody>
<tr>
<td></td>
<td></td>
</tr>
</tbody>
</table>
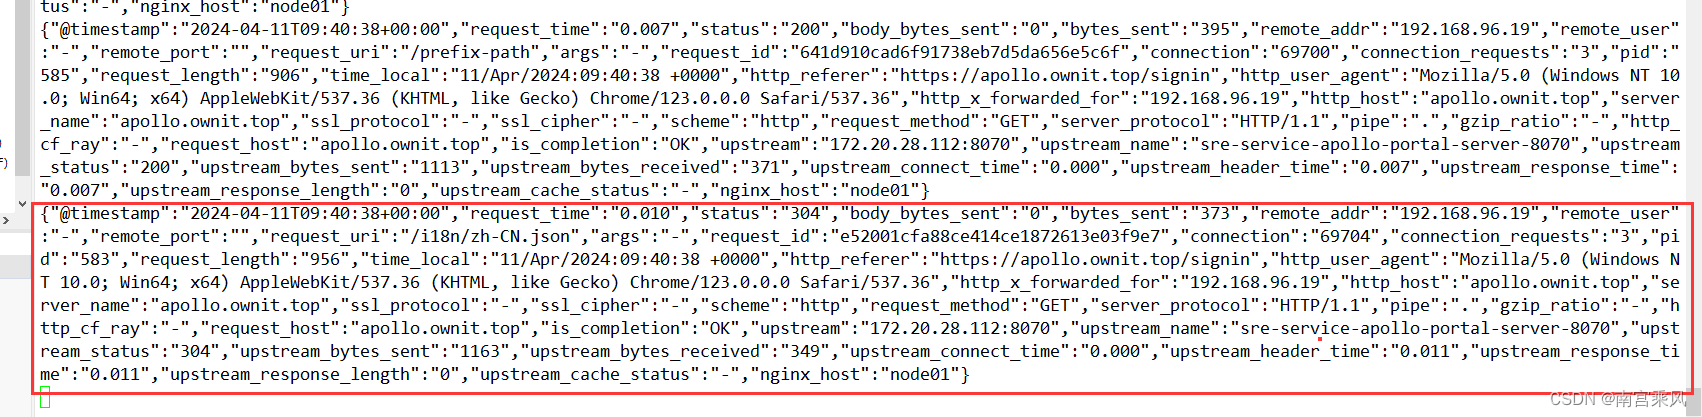
The custom JSON log format is especially useful because it carries more structured information and can be sent directly into ELK for visualization and search.
<table> <thead> <tr> <th>1</th>
<th>{"@timestamp":"$time_iso8601","request_time":"$request_time","status":"$status","body_bytes_sent":"$body_bytes_sent","bytes_sent":"$bytes_sent","remote_addr":"$remote_addr","remote_user":"$remote_user","remote_port":"$remote_port","request_uri":"$request_uri","args":"$args","request_id":"$request_id","connection":"$connection","connection_requests":"$connection_requests","pid":"$pid","request_length":"$request_length","time_local":"$time_local","http_referer":"$http_referer","http_user_agent":"$http_user_agent","http_x_forwarded_for":"$http_x_forwarded_for","http_host":"$http_host","server_name":"$server_name","ssl_protocol":"$ssl_protocol","ssl_cipher":"$ssl_cipher","scheme":"$scheme","request_method":"$request_method","server_protocol":"$server_protocol","pipe":"$pipe","gzip_ratio":"$gzip_ratio","http_cf_ray":"$http_cf_ray","request_host":"$host","is_completion":"$request_completion","upstream":"$upstream_addr","upstream_name":"$proxy_host","upstream_status":"$upstream_status","upstream_bytes_sent":"$upstream_bytes_sent","upstream_bytes_received":"$upstream_bytes_received","upstream_connect_time":"$upstream_connect_time","upstream_header_time":"$upstream_header_time","upstream_response_time":"$upstream_response_time","upstream_response_length":"$upstream_response_length","upstream_cache_status":"$upstream_cache_status","nginx_host":"$hostname"}</th>
</tr>
</thead>
<tbody>
<tr>
<td></td>
<td></td>
</tr>
</tbody>
</table>
Enabling TCP and UDP services
Ingress is often discussed as an HTTP entry point, but NGINX Ingress Controller can also balance TCP and UDP traffic. To enable that, add the relevant controller arguments:
<table> <thead> <tr> <th>1 2 3 4 5 6 7 8 9 10</th>
<th>- /nginx-ingress-controller - --election-id=ingress-controller-leader - --controller-class=k8s.io/ingress-nginx - --configmap=$(POD_NAMESPACE)/ingress-nginx-controller - --validating-webhook=:8443 - --validating-webhook-certificate=/usr/local/certificates/cert - --validating-webhook-key=/usr/local/certificates/key - --watch-ingress-without-class=true - --tcp-services-configmap=$(POD_NAMESPACE)/tcp-services #增加tcp配置 - --udp-services-configmap=$(POD_NAMESPACE)/udp-services #增加upd配置</th>
</tr>
</thead>
<tbody>
<tr>
<td></td>
<td></td>
</tr>
</tbody>
</table>
That makes it possible to use the same controller for non-HTTP workloads such as:
- MySQL, LDAP, and MQTT — common TCP-based application protocols
- DNS, syslog, and RADIUS — common UDP-based services used by edge devices and non-transactional systems
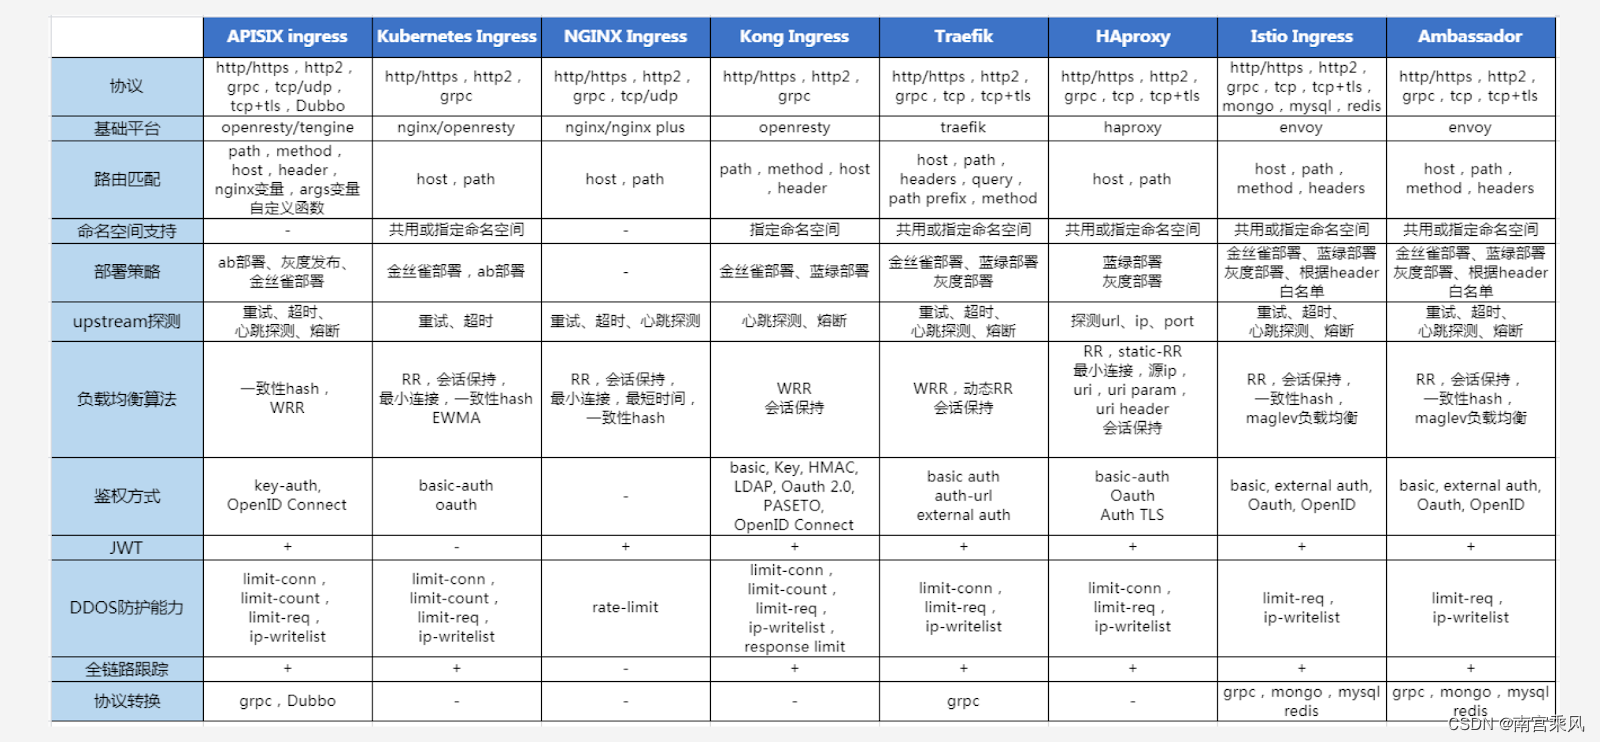
Useful references:
- https://www.niewx.cn/2021/11/09/2021-11-09-Use-Nginx-Ingress-to-expose-TCP-and-udp-services/
- https://www.nginx-cn.net/blog/load-balancing-tcp-and-udp-traffic-in-kubernetes-with-nginx/
Tracing requests through Ingress logs
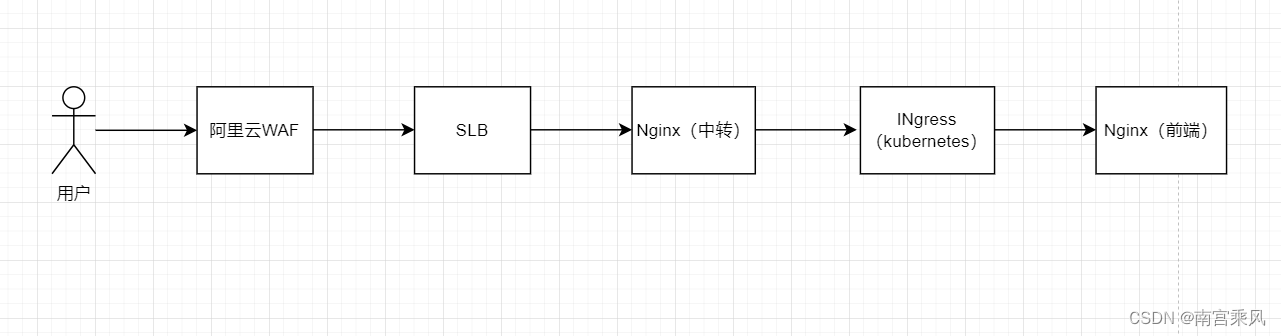
In current internet-facing architectures, it is increasingly common to place a WAF in front of Nginx or Ingress. This combination improves application protection while still keeping the gateway layer manageable and efficient. In that model, it becomes important to understand not only how the layers forward traffic, but also how logs line up across the full request path.
Access flow and log correlation
A practical observation from this kind of setup is that WAF logs are often more detailed than Nginx logs. At the same time, Nginx-layer records may simply reflect what was forwarded from the WAF, so the core request data can appear identical across layers.
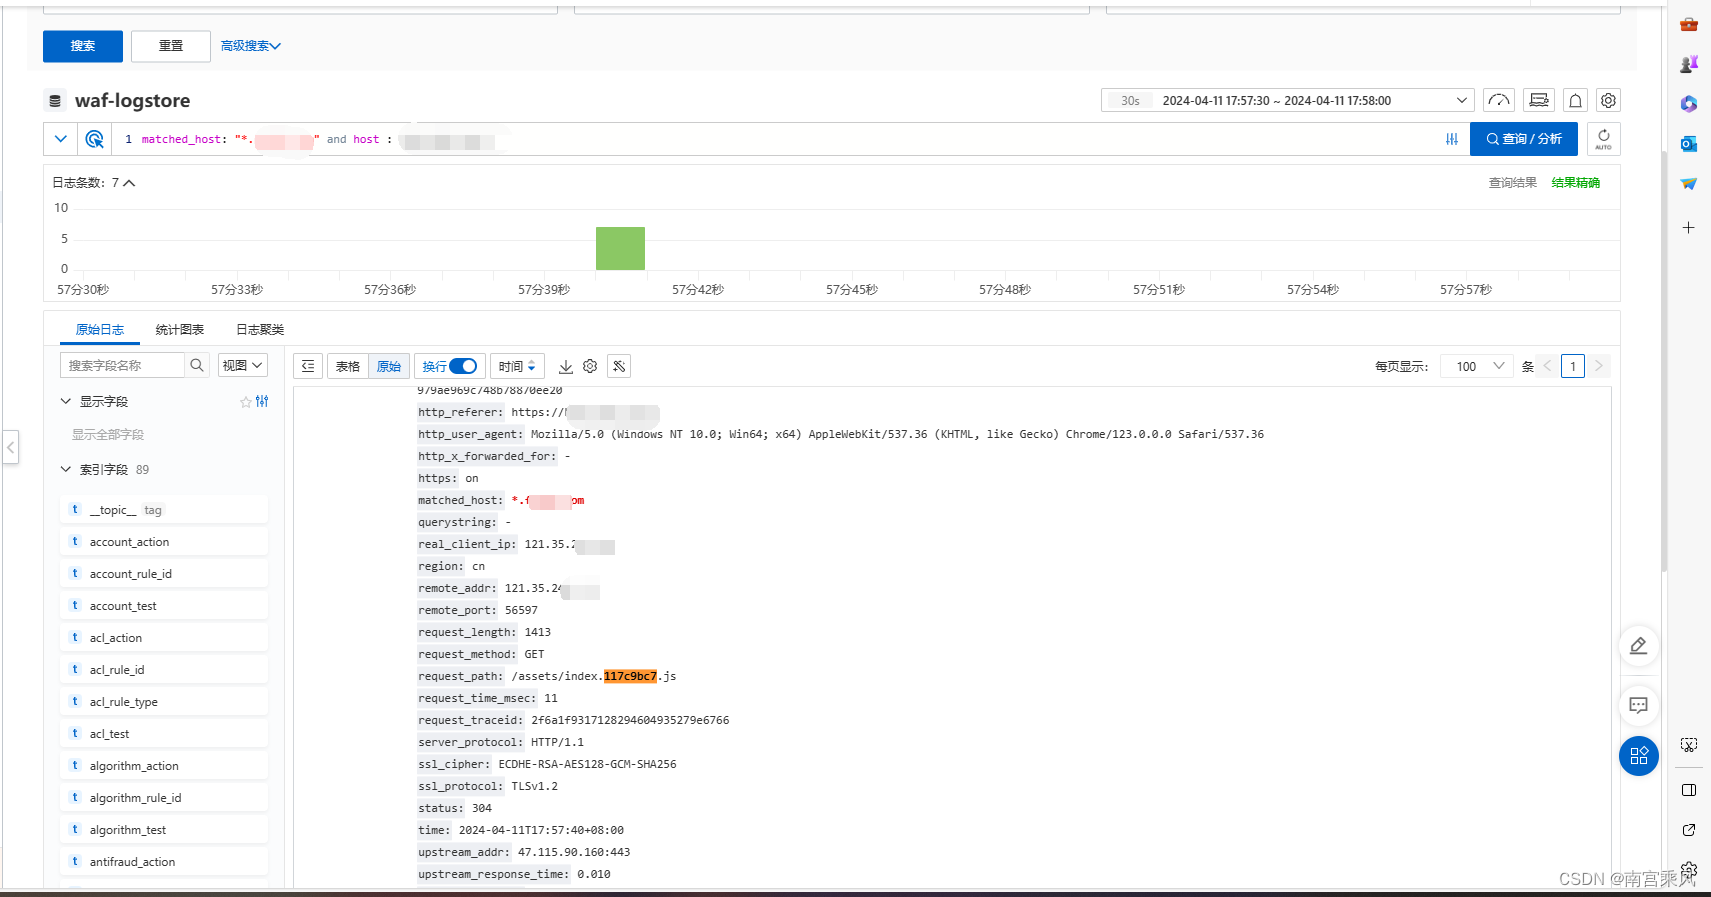
The four screenshots referenced in the original workflow all correspond to a single request. Each layer records it, but the WAF presents the most professional and visualized view.
 Alibaba Cloud WAF
 Nginx transit layer
An example Nginx configuration in front of the cluster:
<table> <thead> <tr> <th>1 2 3 4 5 6 7 8 9 10 11 12 13 14 15 16 17 18 19 20 21 22 23 24 25 26</th>
<th>server { listen 80; server_name xx.xxx.com; # IP白名单 include /usr/local/openresty/nginx/whitelist/corporation.conf; rewrite ^/(.*)$ https://$host/$1 permanent; } server { listen 443 ssl; server_name kpi.xxxx.com; #proxy_read_timeout 180; #proxy_send_timeout 180; # IP白名单 include /usr/local/openresty/nginx/whitelist/corporation.conf; ssl on; ssl_certificate /usr/local/openresty/nginx/ssl/xxx.com.crt; ssl_certificate_key /usr/local/openresty/nginx/ssl/xx.com.key; include ssl.conf; location / { proxy_pass http://kubernetes-cluster; include https_proxy.conf; } }</th>
</tr>
</thead>
<tbody>
<tr>
<td></td>
<td></td>
</tr>
</tbody>
</table>
The upstream points to the Ingress address and port. This also makes the protocol transition clear: Nginx accepts HTTPS, while the downstream Ingress hop is over HTTP.
<table> <thead> <tr> <th>1 2 3 4</th>
<th>[root@nginx sites]# cat kubernetes-cluster.conf upstream kubernetes-cluster { server 172.18.xxx.xxx:80; }</th>
</tr>
</thead>
<tbody>
<tr>
<td></td>
<td></td>
</tr>
</tbody>
</table>
 Ingress transit layer
The Kubernetes objects behind that route can be checked in sequence.
Ingress
<table> <thead> <tr> <th>1 2 3 4 5 6 7 8 9 10 11 12 13 14 15 16</th>
<th>[root@jenkins ops]# kubectl get ingresses -n prod new-fujfu-kpi-frontend -oyaml apiVersion: extensions/v1beta1 kind: Ingress metadata: name: new-fujfu-kpi-frontend namespace: prod resourceVersion: "3381713262" spec: rules: - host: kpi.xxx.com http: paths: - backend: serviceName: new-fujfu-kpi-frontend servicePort: 80 path: /</th>
</tr>
</thead>
<tbody>
<tr>
<td></td>
<td></td>
</tr>
</tbody>
</table>
Service
<table> <thead> <tr> <th>1 2 3 4 5 6 7 8 9 10 11 12 13 14 15 16 17 18 19</th>
<th>[root@jenkins ops]# kubectl get svc -n prod new-fujfu-kpi-frontend -oyaml apiVersion: v1 kind: Service metadata: labels: app: new-fujfu-kpi-frontend name: new-fujfu-kpi-frontend namespace: prod spec: clusterIP: 172.21.14.20 ports: - name: http port: 80 protocol: TCP targetPort: 80 selector: app: new-fujfu-kpi-frontend sessionAffinity: None type: ClusterIP</th>
</tr>
</thead>
<tbody>
<tr>
<td></td>
<td></td>
</tr>
</tbody>
</table>
Pod
<table> <thead> <tr> <th>1 2</th>
<th>[root@jenkins ops]# kubectl get pod -n prod --show-labels | grep "new-fujfu-kpi-frontend" new-fujfu-kpi-frontend.prod-8464c5df44-vsdcw 1/1 Running 0 185d app=new-fujfu-kpi-frontend,notfixedvalue=value-20231009171117,pod-template-hash=8464c5df44</th>
</tr>
</thead>
<tbody>
<tr>
<td></td>
<td></td>
</tr>
</tbody>
</table>
To inspect the request at the Ingress layer directly:
<table> <thead> <tr> <th>1</th>
<th>kubectl logs -f nginx-ingress-controller-7795b48595-n2dcr -n kube-system |grep "kpi.xxxx.com"</th>
</tr>
</thead>
<tbody>
<tr>
<td></td>
<td></td>
</tr>
</tbody>
</table>

Application Pod Nginx
The frontend Nginx is itself just another Pod, and its configuration can be viewed from inside the container:
<table> <thead> <tr> <th>1 2 3 4 5 6 7 8 9 10</th>
<th>root@new-fujfu-kpi-frontend:/etc/nginx/conf.d# cat default.conf server { listen 80; server_name localhost; root /usr/share/nginx/html; index index.html index.htm; location / { try_files $uri /index.html; } }</th>
</tr>
</thead>
<tbody>
<tr>
<td></td>
<td></td>
</tr>
</tbody>
</table>
The Pod can again be identified with:
<table> <thead> <tr> <th>1 2</th>
<th>[root@jenkins ops]# kubectl get pod -n prod --show-labels | grep "new-fujfu-kpi-frontend" new-fujfu-kpi-frontend.prod-8464c5df44-vsdcw 1/1 Running 0 185d app=new-fujfu-kpi-frontend,notfixedvalue=value-20231009171117,pod-template-hash=8464c5df44</th>
</tr>
</thead>
<tbody>
<tr>
<td></td>
<td></td>
</tr>
</tbody>
</table>
One issue that showed up during tracing was incorrect log time inside the Pod. The offset was caused by an 8-hour timezone difference.

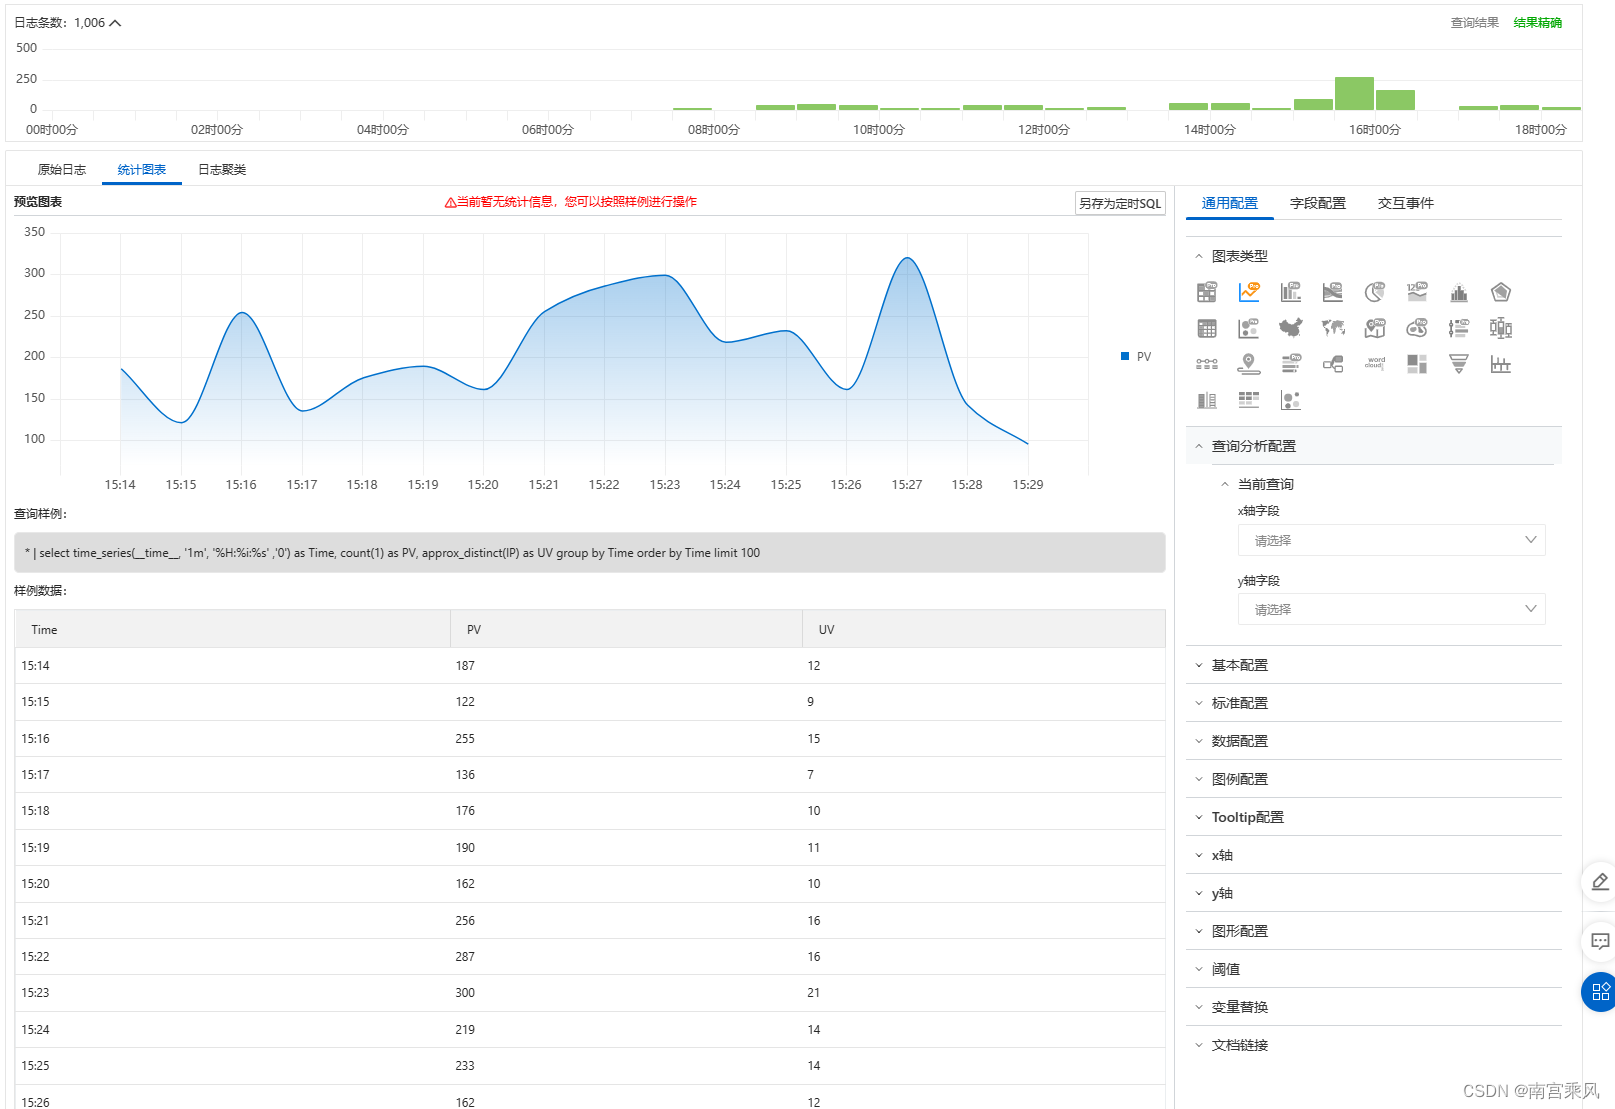
Log analysis and visualization
Once structured logging is in place, log analysis and visualization become much more valuable. Custom log fields can be fed into SIEM platforms, the ELK stack, or similar systems for:
- real-time monitoring
- anomaly detection
- attack behavior analysis
- faster incident response
- visual inspection of request paths and gateway behavior
This is especially useful when traffic passes through multiple layers such as WAF, external Nginx, Ingress, Service, and application Pod. With consistent fields and timestamps, a single request can be traced across the whole chain.
Reference material:
- 从逻辑上深入理解Kubernetes中Ingress及Nginx Ingress Controller的概念及原理
- https://www.cnblogs.com/varden/p/15128802.html
- https://www.modb.pro/db/405641
- Kubernetes安装ingress-nginx