Prometheus is an open-source monitoring, alerting, and time-series database toolkit written in Go. It is widely used for container and infrastructure monitoring, and its growth has been closely tied to the popularity of Kubernetes.
Official documentation: https://prometheus.io/docs/introduction/overview/
Understanding time-series data
Time-series data is data recorded in chronological order to reflect how the state of a system or device changes over time.
Common examples include:
- longitude, latitude, speed, direction, and nearby object distance collected continuously by autonomous vehicles
- vehicle trajectory data across a region
- real-time transaction data in traditional finance
- live operations and infrastructure monitoring data
Why time-series data matters
Time-series workloads are different from ordinary business data. For this type of data, two characteristics are especially important.
Good performance
Traditional relational databases perform poorly when dealing with very large volumes of monitoring data. NoSQL databases handle scale better, but they still do not match a dedicated time-series database in this area.
Lower storage cost
Time-series databases rely on efficient compression algorithms to reduce storage use and I/O overhead. Prometheus uses a highly efficient storage format for time-series data. According to the official figures cited in the original material, each sample takes only about 3.5 bytes. With millions of time series, a 30-second scrape interval, and 60 days of retention, storage usage is roughly a little over 200 GB.
Main features of Prometheus
Prometheus is built around several practical characteristics:
- a multidimensional data model
- a flexible query language
- no dependency on distributed storage; a single server node can operate independently
- collection of time-series data over HTTP using a pull model
- optional support for a push model through an intermediate gateway
- service discovery or static configuration for finding monitoring targets
- support for multiple visualization and interface options
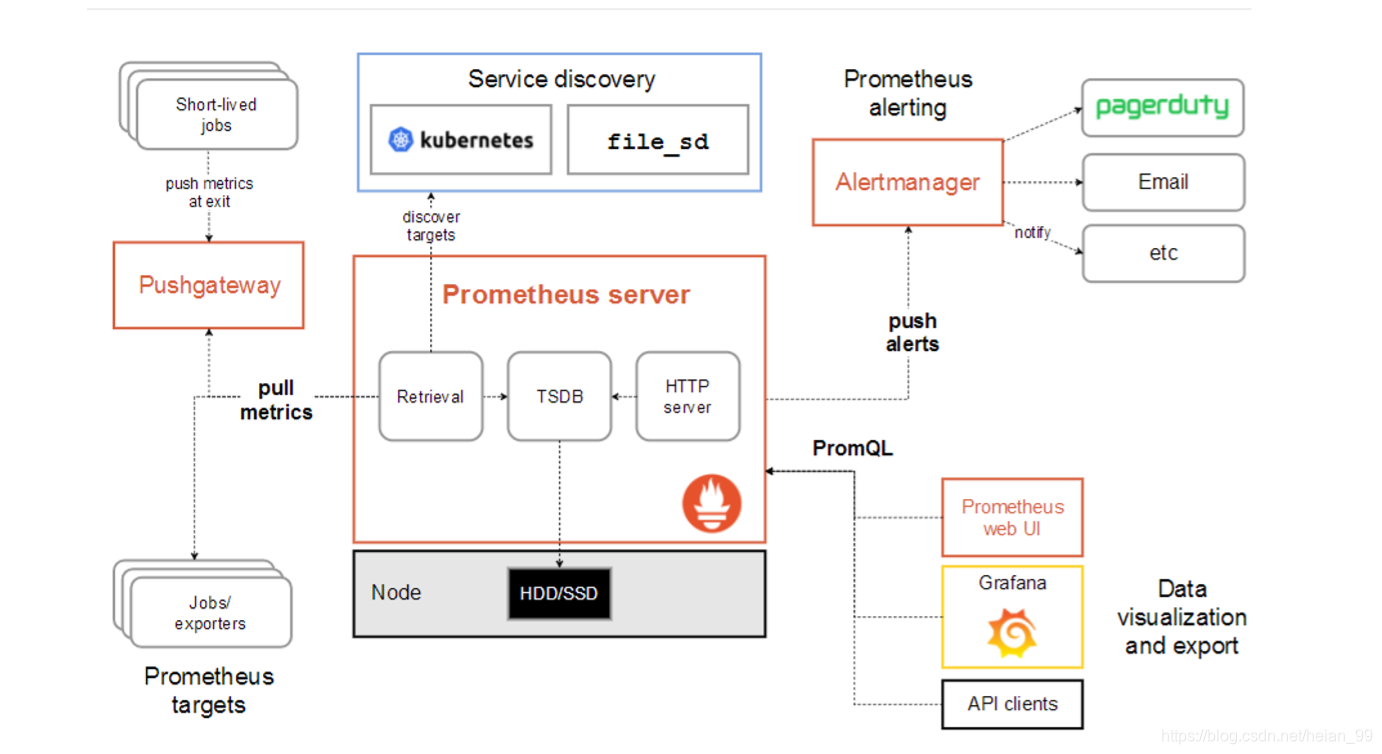
Prometheus architecture
Lab environment
The setup below uses three servers:
<table> <thead> <tr> <th>Server</th> <th>IP Address</th> </tr> </thead> <tbody> <tr> <td>Prometheus server</td> <td>192.168.116.129</td> </tr> <tr> <td>Monitored server</td> <td>192.168.116.130</td> </tr> <tr> <td>Grafana server</td> <td>192.168.116.131</td> </tr> </tbody> </table>Before installation, prepare the environment as follows.
1. Use static IP addresses
Each machine should have a static IP and be able to access the internet.
2. Set hostnames and host mapping
Configure hostnames on each system and make sure all three machines can resolve one another.
各自配置好主机名
# hostnamectl set-hostname --static server.cluster.com
三台都互相绑定IP与主机名
# vim /etc/hosts
192.168.116.129 master
192.168.116.130 node1
192.168.116.131 node2
You can also append the entries in one command:
echo "192.168.116.129 master
192.168.116.130 node1
192.168.116.131 node2">>/etc/hosts
3. Sync system time
Time synchronization should be verified before continuing.
yum install -y ntpdate && ntpdate time.windows.com
4. Disable the firewall and SELinux-related restrictions used in this setup
# systemctl stop firewalld
# systemctl disable firewalld
# iptables -F
Installing Prometheus
Download the appropriate version from: https://prometheus.io/download/
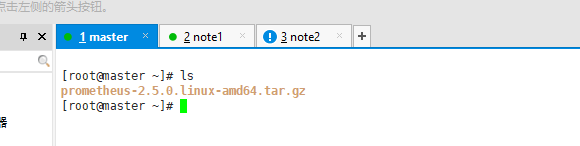
The official release is provided as a binary package, so there is no need to compile it. After downloading, upload prometheus-2.5.0.linux-amd64.tar.gz to the server.
Extract it and move it into place:
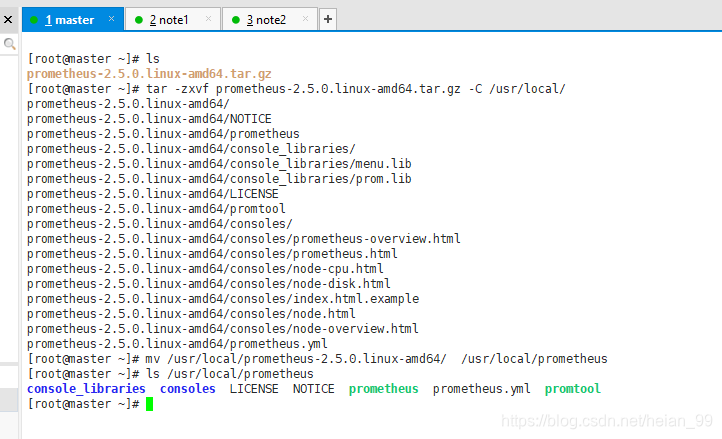
tar -zxvf prometheus-2.5.0.linux-amd64.tar.gz -C /usr/local/
mv /usr/local/prometheus-2.5.0.linux-amd64/ /usr/local/prometheus
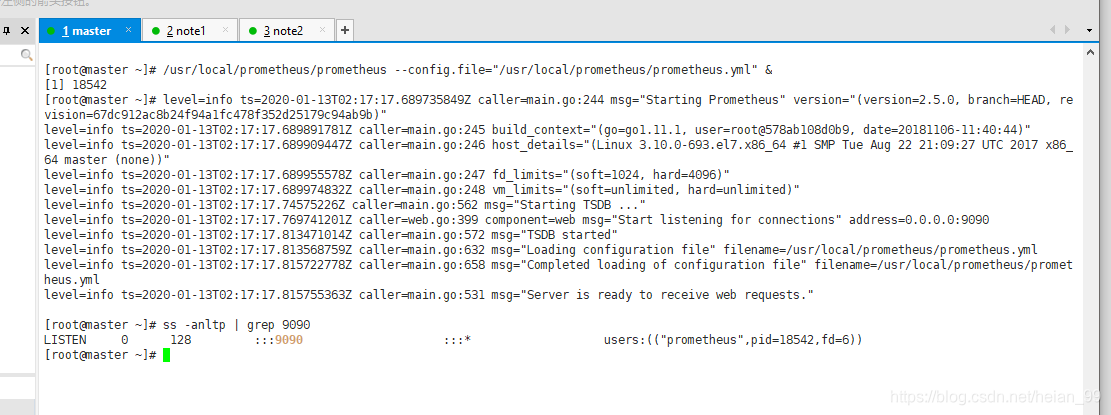
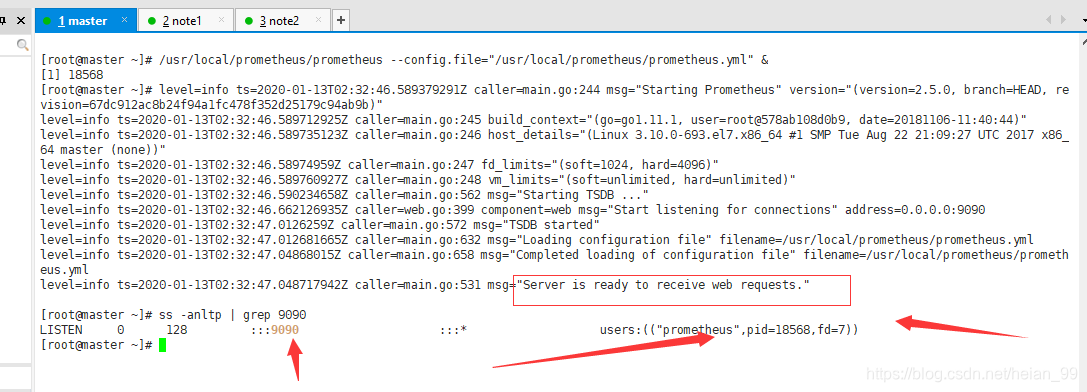
Start Prometheus directly with the default configuration file:
/usr/local/prometheus/prometheus --config.file="/usr/local/prometheus/prometheus.yml" &
Confirm that port 9090 is listening:
ss -anltp | grep 9090
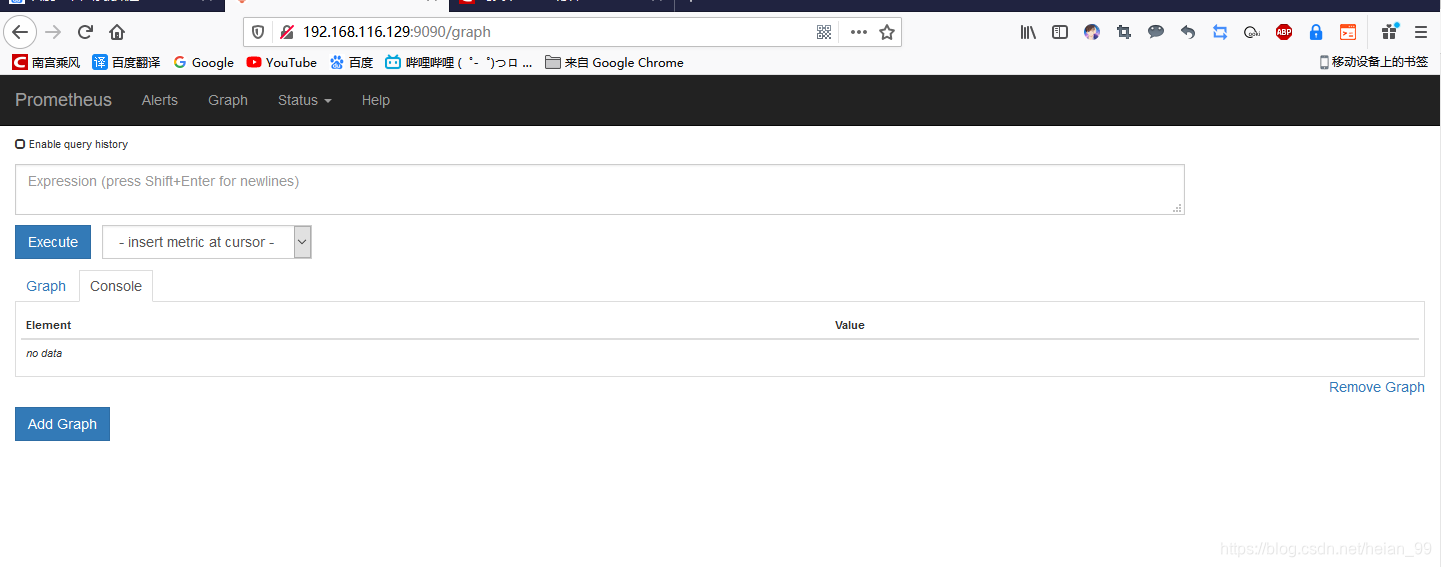
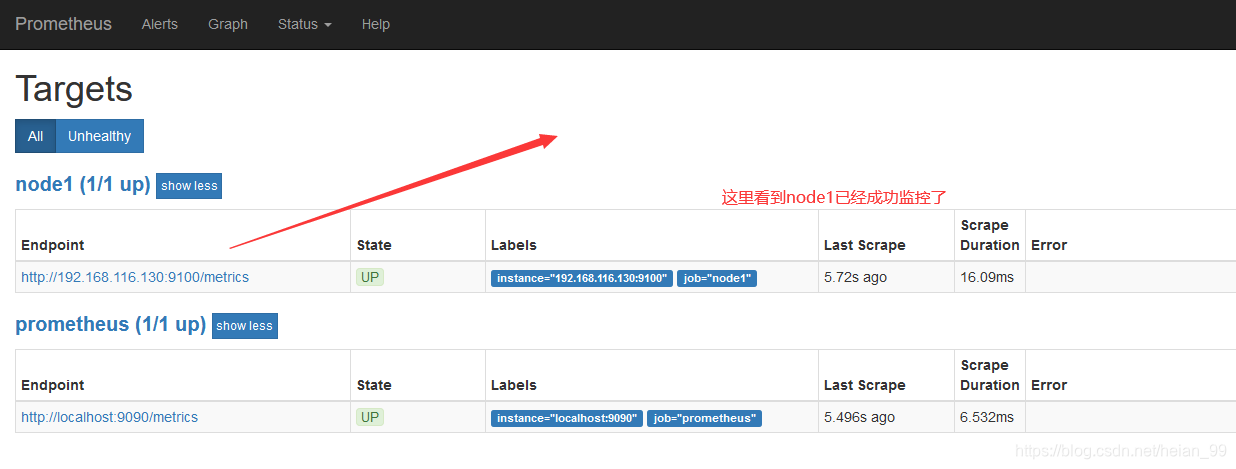
Accessing the Prometheus web interface
Open the browser and visit:
http://server-ip:9090
This brings up the Prometheus main page.
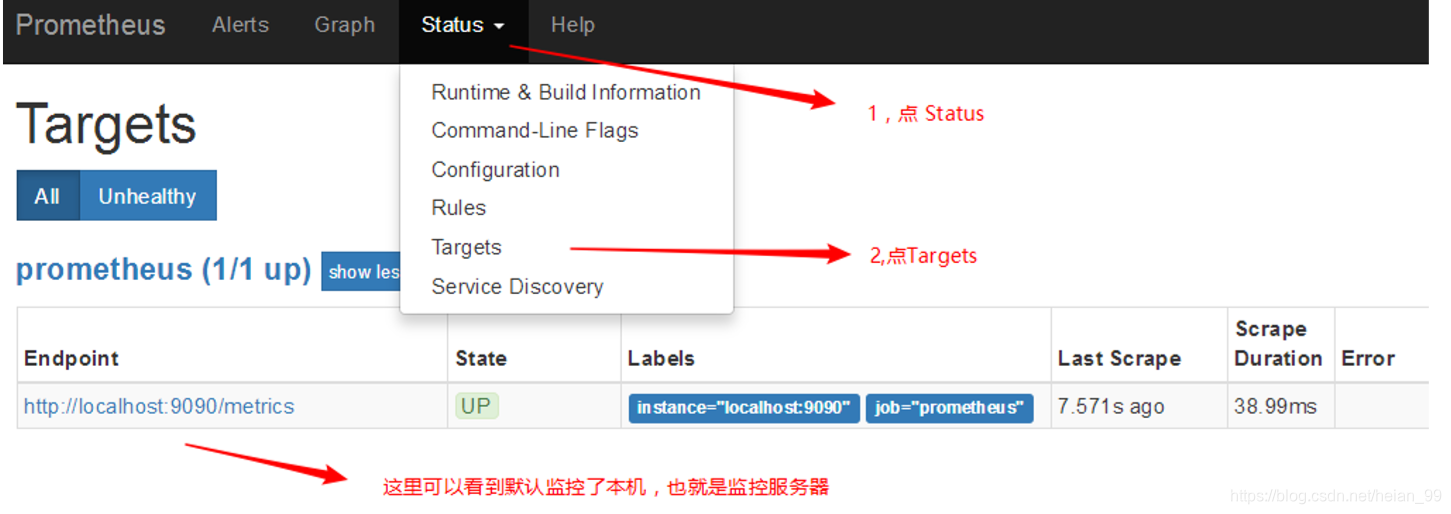
With the default configuration, Prometheus only monitors itself. In the web interface, go to Status → Targets and you will see that only the local target is present.
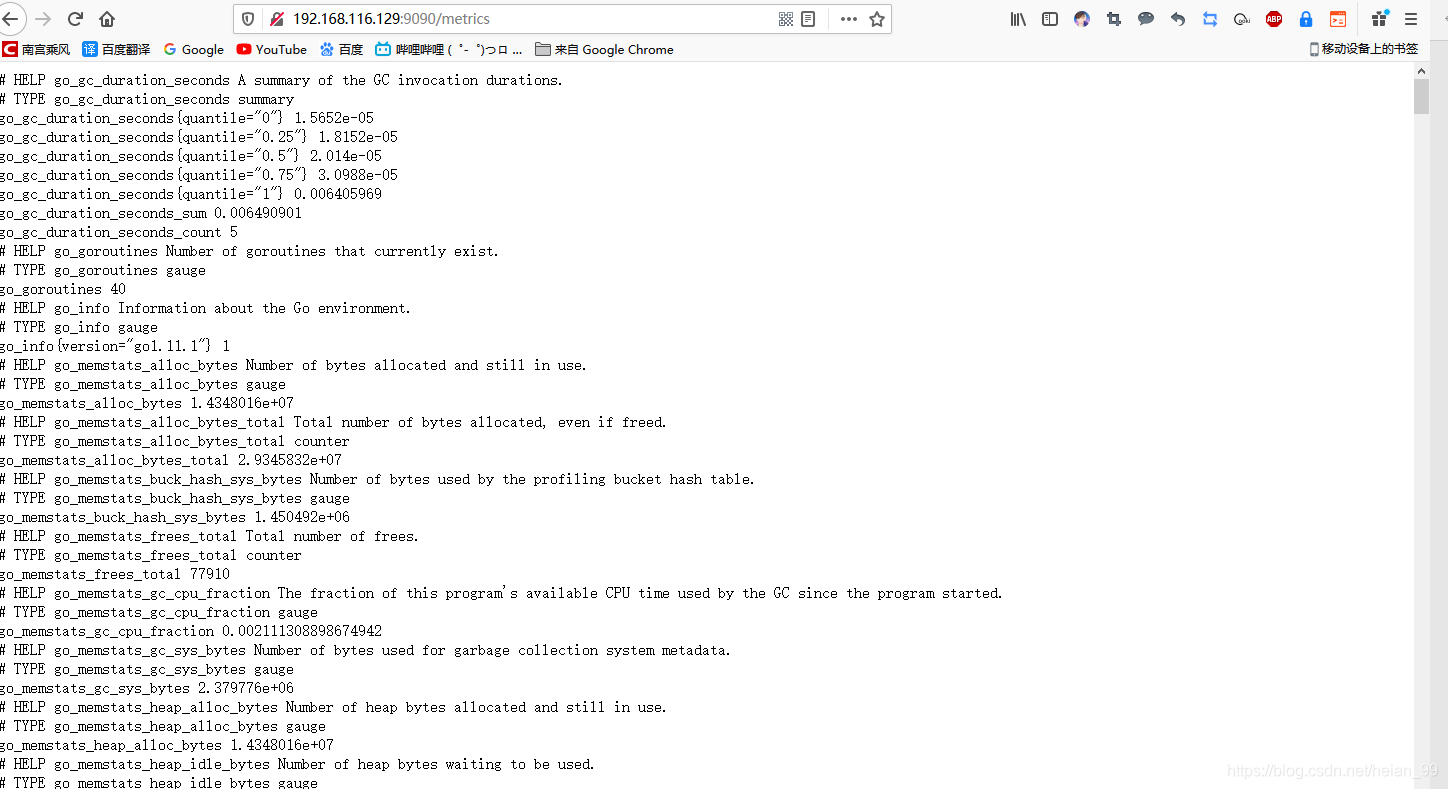
Viewing collected metrics
Prometheus exposes metric data at:
http://server-ip:9090/metrics
You can inspect the raw monitoring data there.
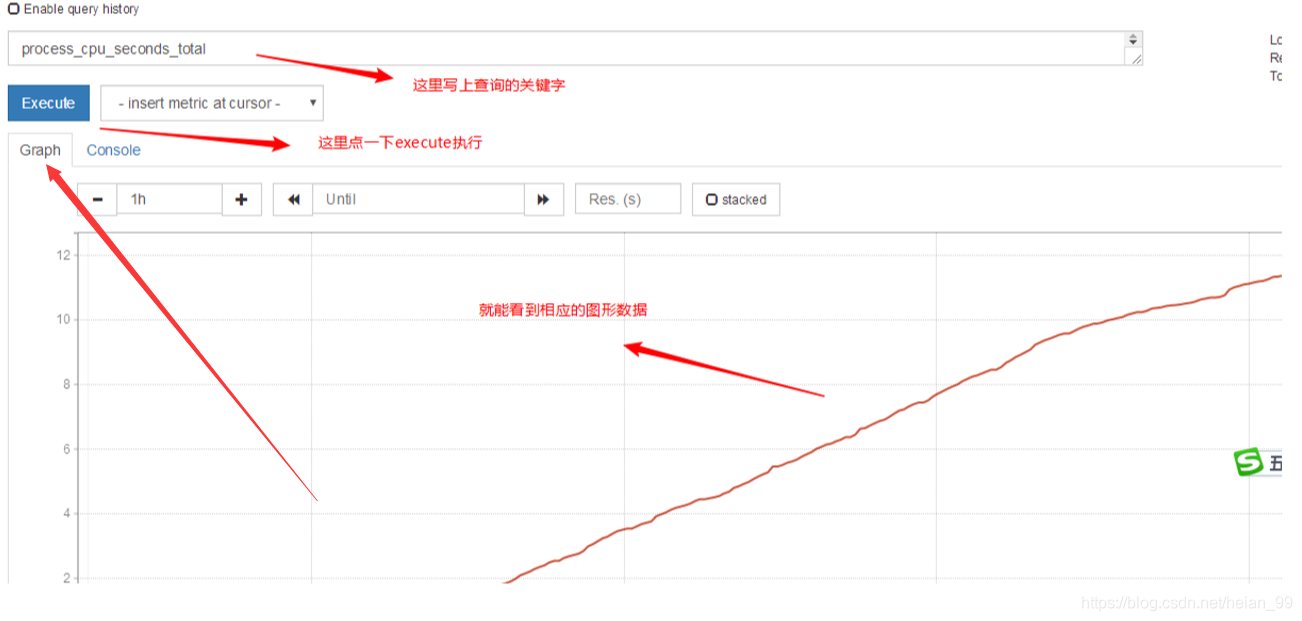
On the main web UI, you can also search metrics by keyword to query specific monitoring items.
Monitoring a remote Linux host
To collect system metrics from another Linux server, install node_exporter on the target machine.
Step 1: Install node_exporter on the monitored server
Download it from: https://prometheus.io/download/
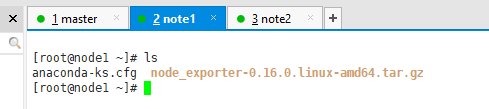
Upload node_exporter-0.16.0.linux-amd64.tar.gz to the remote host.
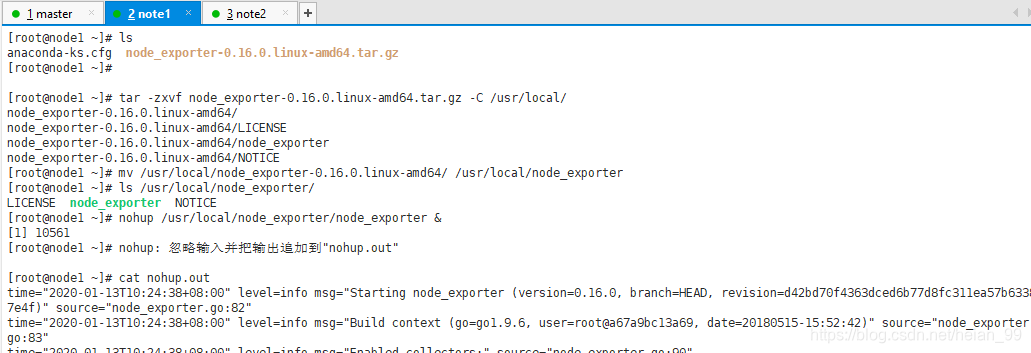
Extract and place it under /usr/local:
tar -zxvf node_exporter-0.16.0.linux-amd64.tar.gz -C /usr/local/
mv /usr/local/node_exporter-0.16.0.linux-amd64/ /usr/local/node_exporter
The package contains a single executable, node_exporter, which can be started directly:
nohup /usr/local/node_exporter/node_exporter &
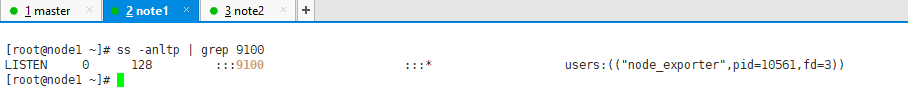
Then confirm that port 9100 is listening.
A quick note about nohup: if you start node_exporter from a terminal and then close that terminal, the process normally exits as well. Using nohup avoids that problem.
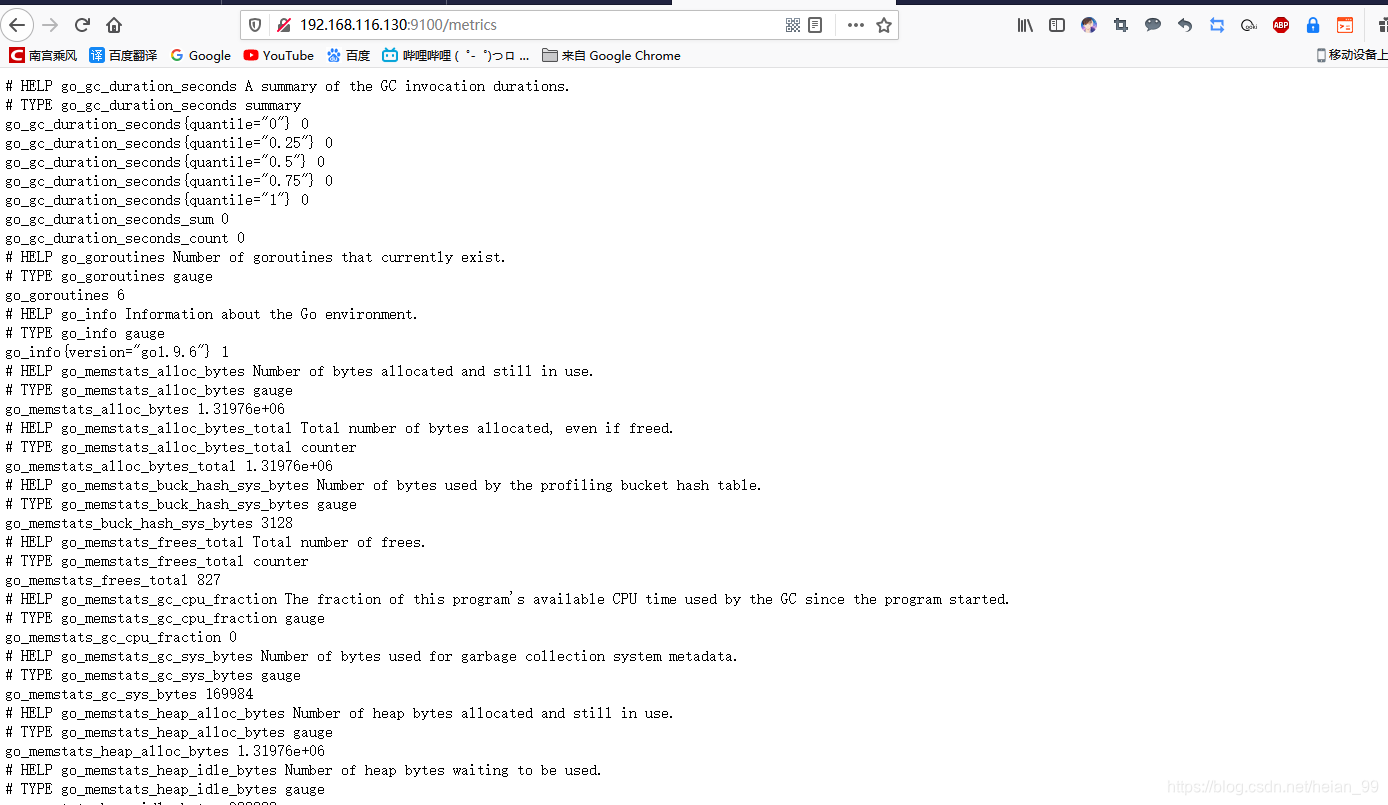
Step 2: Verify metrics on the monitored host
Open the following in a browser:
http://monitored-server-ip:9100/metrics
You should be able to see the metric data collected by node_exporter on the target system.
Step 3: Add the remote target to Prometheus
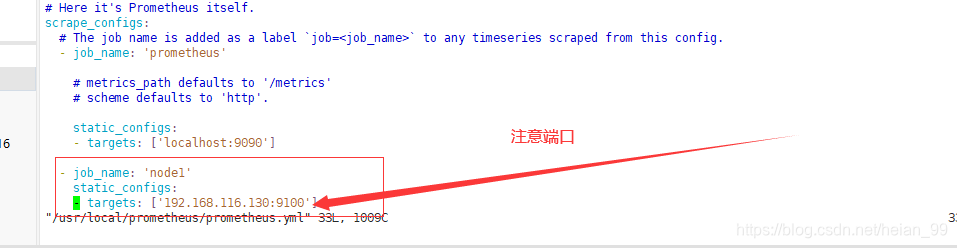
Return to the Prometheus server and edit the main configuration file:
vim /usr/local/prometheus/prometheus.yml
Add the target definition at the end of the file:
- job_name: 'node1'
  static_configs:
  - targets: ['192.168.116.130:9100']
Another example from the same setup uses a different job name and IP:
- job_name: 'agent1'   # 取一个job名称来代 表被监控的机器
  static_configs:
  - targets: ['10.1.1.14:9100']   # 这里改成被监控机器 的IP,后面端口接9100
After updating the configuration, restart Prometheus.
First stop the current process:
pkill prometheus
Confirm that the port is no longer in use.
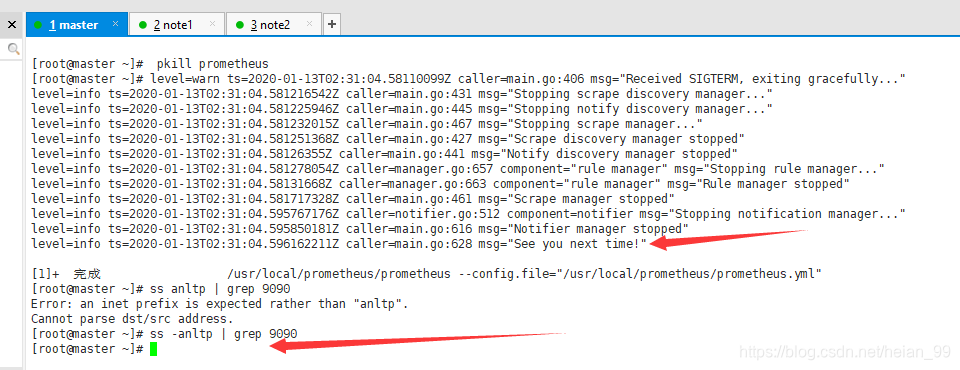
Then start Prometheus again:
/usr/local/prometheus/prometheus --config.file="/usr/local/prometheus/prometheus.yml" &
Check that the port is occupied again, which indicates the restart succeeded.
Step 4: Confirm the new target in the web UI
Go back to Status → Targets in the Prometheus interface. You should now see an additional monitored target.
As a simple exercise, the local Prometheus server itself can also be monitored through node_exporter. The approach is exactly the same: install node_exporter locally and add that endpoint to Prometheus.