A full production troubleshooting case: a blog that seemed perfectly fine in everyday use turned into a disaster under nationwide speed tests. The investigation started with ugly test results and moved through several layers—cross-border traffic behavior, Laravel production caching, Redis that had been installed but never used, and finally the PHP-FPM process model that explained the remaining gap.
Before getting into it
This debugging process assumes some familiarity with:
- basic Laravel usage
- routine operations in the BT panel
- a rough understanding of PHP-FPM, Nginx, and Redis
The tools involved were straightforward:
<table> <thead> <tr> <th>Tool</th> <th>Purpose</th> </tr> </thead> <tbody> <tr> <td>Chinaz tools</td> <td>Nationwide multi-node speed tests with high concurrency</td> </tr> <tr> <td>itdog</td> <td>Nationwide multi-node testing with low-concurrency mode</td> </tr> <tr> <td>SSH + BT panel</td> <td>Server inspection and configuration changes</td> </tr> </tbody> </table>The setup and the symptom
The server was a Hong Kong VPS running Ubuntu 24.04 LTS, with 1.9 GB of RAM and 77 GB of disk space. The stack was:
- Laravel 12
- Filament 4
- PHP 8.3
- Nginx
- MySQL
- Redis
The site being tested was blog.gankudadiz.com.
In a local browser, the blog loaded in about 700 ms. Subjectively, it felt normal. But once the homepage was tested through a nationwide speed test service, the picture changed completely: most regions showed response times in the 5–10 second range, with large areas marked red.
First question: is it the network, or the server?
The first pass was to separate network-level issues from application-level ones.
Ping checks
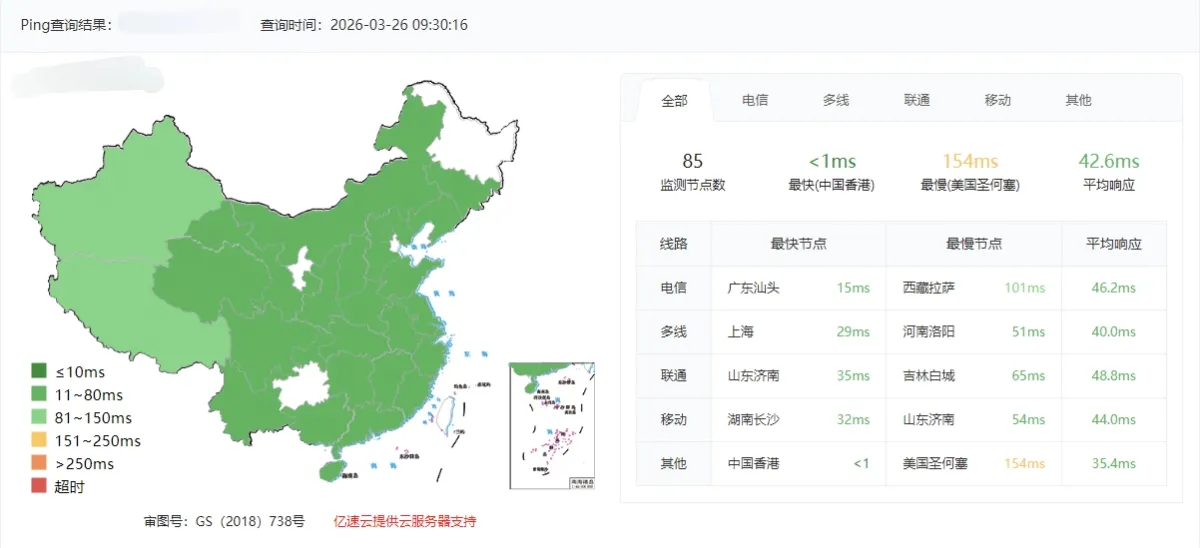
Both the server IP and the domain were pinged first.
Ping server IP (x.x.x.x)
Ping blog domain (blog.gankudadiz.com)
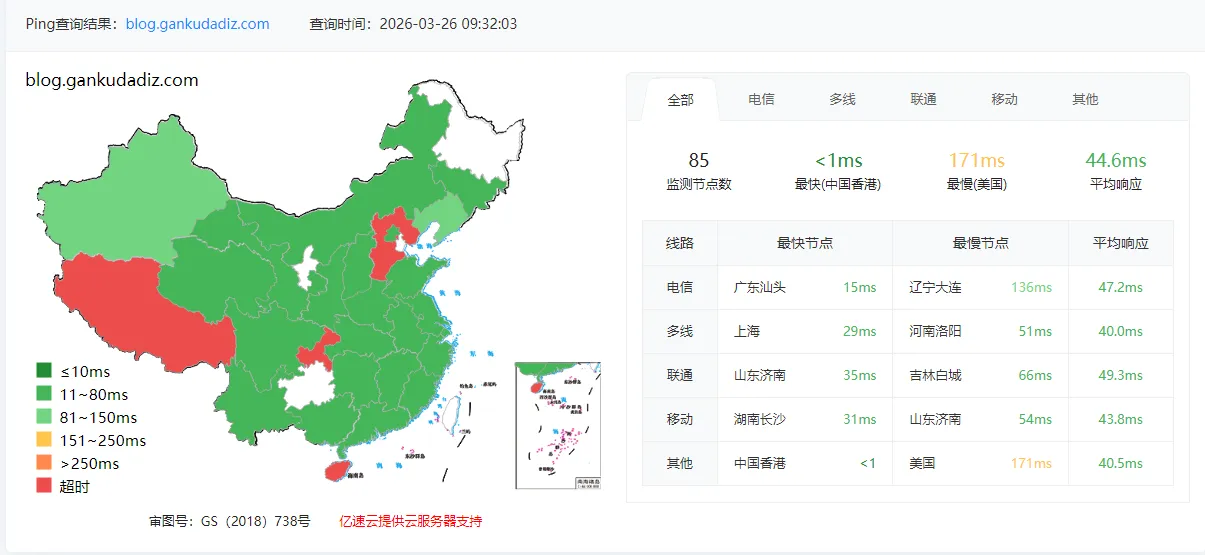
The average latency came back at roughly 42 ms. That meant the route itself was alive and the Hong Kong-to-mainland path was not obviously broken.
HTTP speed test from multiple mainland nodes
The homepage was then tested through https://tool.chinaz.com/.
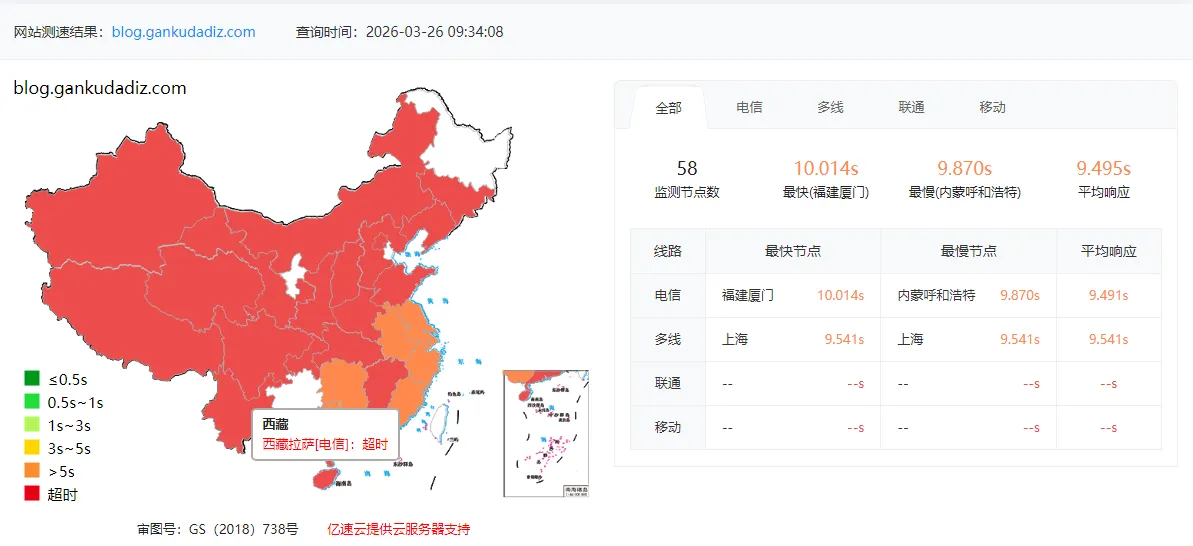
The result was brutal: most nodes were taking 5–10 seconds, almost entirely red.
Initial read on the mismatch
Fast ping but slow HTTP usually points to a protocol-level difference rather than a simple connectivity issue.
graph TD
    A[用户请求] --> B{协议类型}
    B -->|ICMP Ping| C[GFW 几乎不干预]
    B -->|HTTP/HTTPS| D[深度包检测 DPI]
    C --> E[42ms 正常]
    D --> F[香港->大陆 QoS 限速]
    F --> G[5~10s 超时]
The early suspicion was that HTTP traffic from Hong Kong to mainland China was being treated differently from ICMP. That could explain part of the problem, but not all of it. The application layer still needed to be examined carefully.
Looking inside the production environment
After logging into the server over SSH, the production configuration was checked item by item.
# SSH 连接命令
ssh -i "~/.ssh/id_ed25519" -p xxxx [email protected]
What the inspection found
<table> <thead> <tr> <th>Check item</th> <th>Problem found</th> <th>Impact</th> </tr> </thead> <tbody> <tr> <td>Laravel bootstrap/cache</td> <td>Onlypackages.php and services.php; no config.php / routes.php</td>
<td>Config and routes were re-parsed on every request, adding 100–300 ms</td>
</tr>
<tr>
<td>CACHE_DRIVER</td>
<td>Not set in .env, so it fell back to file</td>
<td>Redis was installed, but cache reads and writes still hit disk</td>
</tr>
<tr>
<td>SESSION_DRIVER</td>
<td>Set to database, so every request queried the MySQL sessions table</td>
<td>One extra DB query per request</td>
</tr>
<tr>
<td>Redis</td>
<td>Redis 8.0.4 running normally, phpredis installed</td>
<td>Available, but not actually being used</td>
</tr>
<tr>
<td>PHP OPcache</td>
<td>Enabled, 128 MB</td>
<td>Fine ✅</td>
</tr>
<tr>
<td>Nginx gzip</td>
<td>Enabled globally and configured properly</td>
<td>Fine ✅</td>
</tr>
<tr>
<td>Nginx JS/CSS cache</td>
<td>expires 12h, a bit short</td>
<td>Browsers had to re-request static assets too often</td>
</tr>
</tbody>
</table>
The biggest wasted opportunity was obvious: Redis had been deployed correctly, but the application was barely using it.
The key issue: Redis existed, Laravel ignored it
The relevant part of the original .env looked like this:
# .env 中的原始配置(问题版本)
APP_ENV=production
APP_DEBUG=false
SESSION_DRIVER=database   # 每次请求查 MySQL
# CACHE_DRIVER 未设置      # 默认 file,走磁盘
REDIS_CLIENT=phpredis
REDIS_HOST=127.0.0.1
REDIS_PORT=6379
That meant a normal HTTP request effectively followed this path:
sequenceDiagram
    participant 用户
    participant Nginx
    participant PHP-FPM
    participant 磁盘
    participant MySQL

    用户->>Nginx: HTTP 请求
    Nginx->>PHP-FPM: 转发
    PHP-FPM->>磁盘: 读取路由缓存(不存在,重新解析)
    PHP-FPM->>磁盘: 读取配置缓存(不存在,重新解析)
    PHP-FPM->>MySQL: 查询 sessions 表(验证会话)
    PHP-FPM->>磁盘: 读取 file 缓存
    PHP-FPM->>Nginx: 返回响应
    Nginx->>用户: 输出
So even before talking about cross-border traffic, the app had several avoidable penalties built into every request.
The changes that were actually made
Because this was production, the rule was simple: back up first, inspect before changing anything, then verify every step.
1) Back up critical files
# 备份 .env
cp /www/wwwroot/gankudadiz_blog/.env \
   /www/wwwroot/gankudadiz_blog/.env.backup.$(date +%Y%m%d%H%M%S)

# 备份 Nginx 站点配置
cp /www/server/panel/vhost/nginx/blog.gankudadiz.com.conf \
   /www/server/panel/vhost/nginx/blog.gankudadiz.com.conf.backup.$(date +%Y%m%d%H%M%S)
2) Move cache and sessions to Redis
The first fix was to stop sending sessions to MySQL and stop using file-based cache.
# 将 SESSION_DRIVER 改为 redis
sed -i 's/SESSION_DRIVER=database/SESSION_DRIVER=redis/' .env

# 在 REDIS_CLIENT 前插入 CACHE_DRIVER=redis
sed -i '/REDIS_CLIENT/i CACHE_DRIVER=redis' .env
After the change, the important lines became:
CACHE_DRIVER=redis     # 从 file 改为 redis
SESSION_DRIVER=redis   # 从 database 改为 redis
REDIS_CLIENT=phpredis
REDIS_HOST=127.0.0.1
REDIS_PORT=6379
This alone removed unnecessary disk I/O and eliminated one database lookup from each request.
3) Generate full Laravel production caches
Next came Laravel’s production cache generation.
cd /www/wwwroot/gankudadiz_blog
/www/server/php/83/bin/php artisan optimize
The output was:
INFO  Caching framework bootstrap, configuration, and metadata.

  config ............................................... 171.57ms DONE
  events ................................................. 1.86ms DONE
  routes ............................................... 289.12ms DONE
  views ..................................................... 24s DONE
  blade-icons ........................................... 28.66ms DONE
  filament .............................................. 41.17ms DONE
The 24-second view cache step looked dramatic, but it was expected. Filament 4 ships with a large number of Blade components, so precompiling views takes time.
4) Extend browser caching for static assets
The Nginx config for JS and CSS had also been a bit conservative. Static asset cache time was increased from 12 hours to 30 days.
# 将 JS/CSS 缓存从 12h 改为 30d
sed -i 's/expires      12h;/expires      30d;/' \
    /www/server/panel/vhost/nginx/blog.gankudadiz.com.conf

# 验证修改
nginx -t && nginx -s reload
Before and after:
# 修改前
location ~ .*\.(js|css)?$ {
    expires      12h;   # 用户每 12 小时重新请求一次 CSS/JS
}

# 修改后
location ~ .*\.(js|css)?$ {
    expires      30d;   # 浏览器缓存 30 天,显著减少重复请求
}
For repeat visitors, that reduces a lot of unnecessary requests.
5) Verify everything
Nothing was assumed. The final step was to confirm each change directly.
# 1. 确认 .env 配置
grep -E 'CACHE_DRIVER|SESSION_DRIVER' .env
# SESSION_DRIVER=redis
# CACHE_DRIVER=redis

# 2. 确认缓存文件已生成
ls /www/wwwroot/gankudadiz_blog/bootstrap/cache/
# blade-icons.php  config.php  events.php  filament/
# packages.php  routes-v7.php  services.php

# 3. 确认 Nginx 缓存
grep 'expires' /www/server/panel/vhost/nginx/blog.gankudadiz.com.conf
# expires 30d;
The real bottleneck that remained: PHP-FPM concurrency behavior
After those optimizations, another round of tests was run—this time using itdog, because it supports low-concurrency testing as well as faster concurrent checks.
The results suddenly split into two very different stories.
Low-concurrency test result (sequential requests):
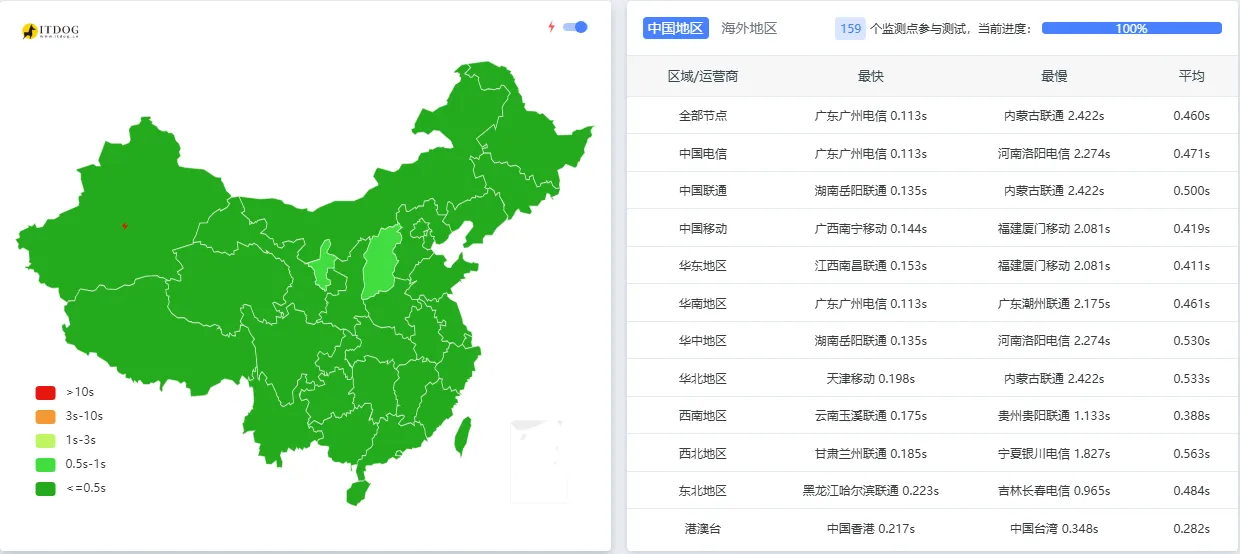
Fast test result (concurrent requests):
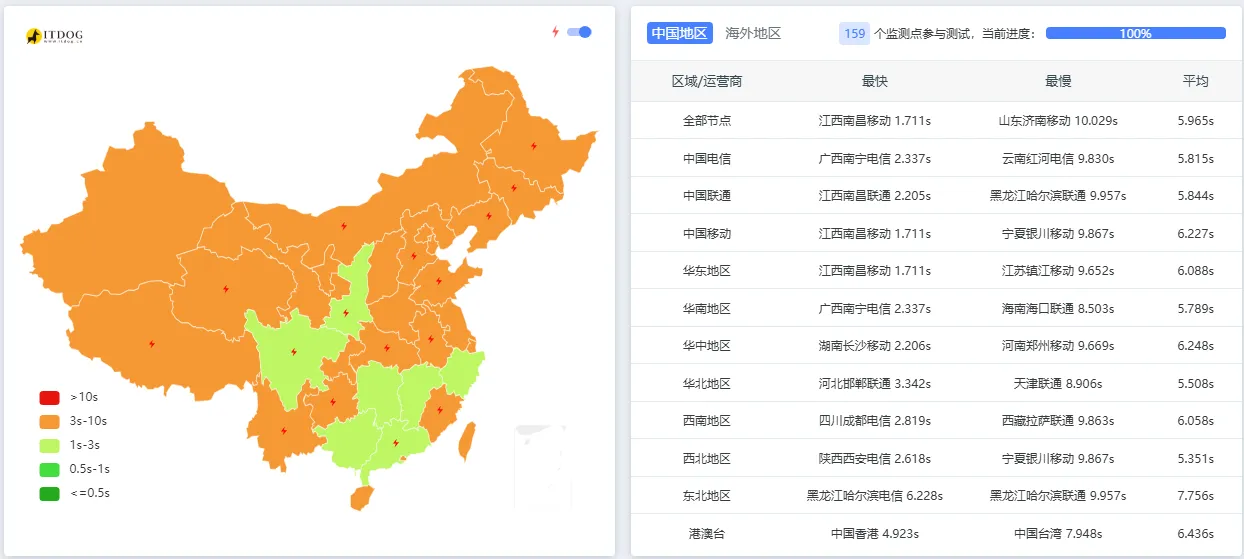
At that point the network theory alone no longer fit. Sequential requests were fine. The problem showed up mainly when several requests arrived together.
The root cause: pm = ondemand
Checking the PHP-FPM configuration revealed this:
grep -E '^pm|^pm\.' /www/server/php/83/etc/php-fpm.conf

# 输出:
# pm = ondemand
# pm.max_children = 30
# pm.start_servers = 5       <- ondemand 模式下无效
# pm.min_spare_servers = 5   <- ondemand 模式下无效
# pm.max_spare_servers = 10  <- ondemand 模式下无效
The important line was pm = ondemand.
In this mode, worker processes are not kept resident when idle. They are created when traffic arrives. That saves memory, but it also means concurrency bursts pay the startup cost.
sequenceDiagram
    participant 测速工具
    participant PHP-FPM
    participant Laravel

    Note over PHP-FPM: 平时无 worker 进程常驻
    测速工具->>PHP-FPM: 并发 20 个请求同时到达
    PHP-FPM->>PHP-FPM: 逐个创建 worker(耗时)
    PHP-FPM->>Laravel: 加载框架初始化
    Laravel-->>测速工具: 响应(5~10s)

    Note over 测速工具: 低并发模式(顺序请求)
    测速工具->>PHP-FPM: 请求 #1
    PHP-FPM->>PHP-FPM: 创建 worker
    Laravel-->>测速工具: 响应(0.5s)
    Note over PHP-FPM: worker 保持存活
    测速工具->>PHP-FPM: 请求 #2(复用已有 worker)
    Laravel-->>测速工具: 响应(0.5s)✅
That matched the test pattern exactly. In low-concurrency mode, the site was quick. Under concurrent synthetic testing, PHP-FPM had to spin up workers one by one, and the latency exploded.
Why the PHP-FPM mode was left unchanged
Even after finding the cause, the decision was to keep ondemand.
That sounds counterintuitive until the site’s actual usage pattern is considered:
- traffic is extremely low, so real bursts are rare
- the server is also meant to host other low-traffic utility sites, so memory has to be shared sensibly
ondemandkeeps idle memory usage close to zero, which is helpful on a small VPS- the concurrency pattern created by speed test tools is artificial and doesn’t reflect real user behavior here
So the concurrency score in a benchmark did not matter as much as real-world responsiveness. For ordinary visits, the blog was already around 0.5 seconds after optimization, which was entirely acceptable.
What changed overall
The practical improvements looked like this:
<table> <thead> <tr> <th>Change</th> <th>Before</th> <th>After</th> <th>Expected gain</th> </tr> </thead> <tbody> <tr> <td>CACHE_DRIVER</td> <td>file (disk)</td>
<td>redis (memory)</td>
<td>Cache operations become much faster</td>
</tr>
<tr>
<td>SESSION_DRIVER</td>
<td>database (MySQL query)</td>
<td>redis (memory)</td>
<td>One less DB query per request</td>
</tr>
<tr>
<td>Laravel caches</td>
<td>Not generated</td>
<td>Full config/routes/views cache</td>
<td>Route parsing overhead effectively removed</td>
</tr>
<tr>
<td>Nginx static cache</td>
<td>expires 12h</td>
<td>expires 30d</td>
<td>Far fewer repeat requests for returning users</td>
</tr>
</tbody>
</table>
What this case made clear
A few lessons stood out.
Ping and page speed are not the same thing
A healthy ping only proves that ICMP is fine. It says very little about how HTTP or HTTPS traffic will behave, especially on routes where protocol handling differs.
The testing method matters as much as the tool
A high-concurrency stress-style speed test is useful for busy sites. It is far less meaningful for a personal blog with very low traffic. For this case, itdog’s low-concurrency mode was much closer to how real users would experience the site.
Installing Redis is not the same as using Redis
This is a common production oversight. Redis may be installed, running, and fully available, while the app still uses file cache and database sessions because .env was never updated. Checking CACHE_DRIVER and SESSION_DRIVER should be a baseline step.
artisan optimize belongs in deployment, not as an afterthought
If deployment finishes after git pull and no optimization step runs, Laravel keeps paying the cost of route, config, and view parsing repeatedly. Production deployments should regenerate those caches every time.
ondemand and dynamic are both valid—depending on the workload
For a low-traffic multi-site VPS, ondemand is memory-friendly. For a busier single-site setup, dynamic may be the better fit because workers stay warm. There is no universally correct choice.
A practical deployment checklist
To avoid repeating the same mistakes, the deployment flow should include the framework optimization steps explicitly:
cd /www/wwwroot/gankudadiz_blog

git pull
/www/server/php/83/bin/php /usr/bin/composer install --no-dev --optimize-autoloader
/www/server/php/83/bin/php artisan migrate --force
/www/server/php/83/bin/php artisan optimize:clear
/www/server/php/83/bin/php artisan optimize
/www/server/php/83/bin/php artisan queue:restart
In the end, the site had not been suffering from a single dramatic failure. It was several smaller issues stacked together: cross-border HTTP behavior, missing Laravel production caches, Redis sitting idle, and a PHP-FPM mode that exposed itself only under concurrent synthetic tests. Once those were separated and tested properly, the “mystery slowness” looked much less mysterious.