Introduction
As distributed systems continue to grow, conventional monitoring approaches are no longer enough for real-time processing and anomaly detection across massive volumes of log data. Relying on manual intervention slows response time and increases the chance that failures will escalate before anyone acts. That is why many teams are moving toward AI-assisted, end-to-end anomaly monitoring paired with automated self-healing. Done well, this kind of platform can improve system stability while reducing day-to-day operations overhead.
What follows is a practical breakdown of how such a platform can be built: the overall architecture, the role of each module, implementation details, and the issues that tend to surface in production.
Platform architecture
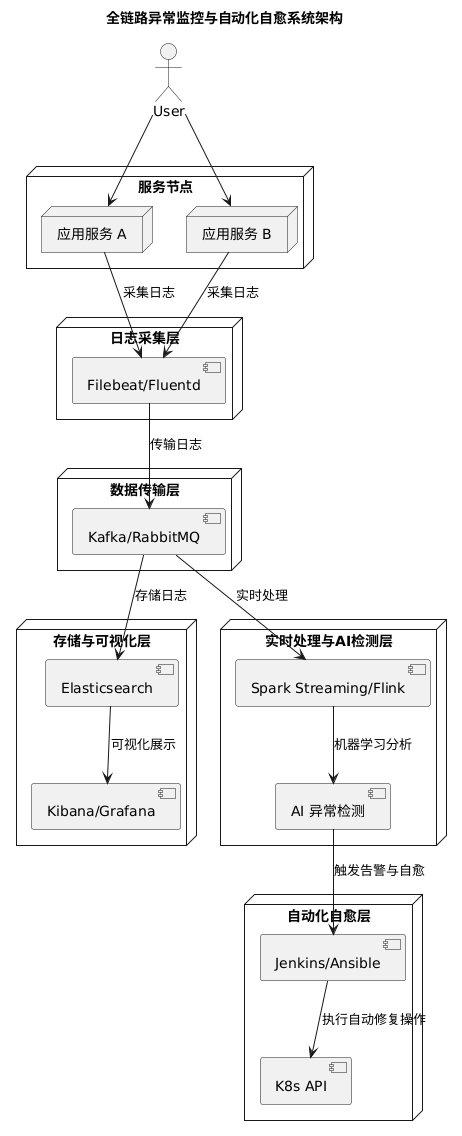
A complete solution can be divided into five main layers:
-
Log collection
Agents such as Filebeat or Fluentd run on service nodes to read logs in real time and normalize them before forwarding. -
Data transport
Kafka or RabbitMQ provides a reliable messaging backbone for asynchronous log delivery, helping the system handle high throughput while remaining fault tolerant. -
Storage and visualization
Elasticsearch stores the logs, while Kibana or Grafana is used for querying, analysis, and dashboard-based visualization. -
Real-time processing and AI-based anomaly detection
Spark Streaming or Flink processes incoming log streams in real time. On top of that, statistical models or machine learning models detect unusual patterns and generate alerts. -
Automated self-healing
Once an anomaly is confirmed, the platform can trigger operational actions such as service restarts, scaling, or failover through CI/CD tooling or the Kubernetes API.
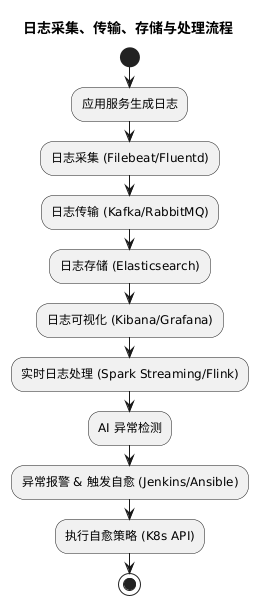
A simplified flow looks like this:
[Service Nodes]
    │
    ▼  Filebeat/Fluentd (log collection)
[Kafka/RabbitMQ] —— asynchronous log transport ——► [Elasticsearch] ——► Visualization (Kibana/Grafana)
                                     │
                                     ▼
                          [Spark Streaming/Flink]
                                     │
                                     ▼
                           AI anomaly detection
                                     │
                                     ▼
                 Automated self-healing and alerting (Jenkins/Ansible/K8s API)
Implementation path
1. Collecting and transporting logs
Deploy log collection agents
A practical starting point is Filebeat, mainly because it is lightweight and easy to configure.
Typical steps include:
- Install Filebeat on every service node, either through a package manager or in containers.
- Edit
filebeat.ymlto define the log path and Kafka output. - Start the service and verify that logs are reaching Kafka correctly.
  filebeat.inputs:
    - type: log
      enabled: true
      paths:
        - /var/log/myapp/*.log

  output.kafka:
    hosts: ["kafka1:9092", "kafka2:9092"]
    topic: "logs_topic"
Build the message queue layer
If Kafka is chosen, it should be deployed as a cluster. A setup of at least three nodes is generally recommended for high availability.
A dedicated topic should be created for log transport, with partition counts sized according to expected traffic volume. For example, a topic might be configured with 10 partitions if log throughput justifies it. Downstream consumers can join a consumer group so that log processing is load-balanced and resilient to failures.
2. Storing and visualizing logs
Deploy Elasticsearch
Elasticsearch can be run through Docker Compose in smaller environments or on Kubernetes for larger, more flexible deployments. A cluster of three or more nodes is a reasonable baseline.
Logs can enter Elasticsearch through Logstash or through a direct Kafka consumer. It is also worth designing a sensible indexing strategy early, such as creating indices by date to improve query efficiency and simplify retention management.
Set up dashboards
Kibana is the natural choice when Elasticsearch is already in use, though Grafana with the Elasticsearch plugin also works well. At this stage, teams usually create dashboards for metrics such as:
- error rate
- response time
- traffic fluctuations
- service-specific operational indicators
These dashboards become the shared operational view for both monitoring and incident response.
3. Real-time processing and anomaly detection
Choose a stream processing engine
Either Spark Streaming or Flink can serve as the real-time processing layer. In practice, the better choice often depends less on features and more on what the team already knows how to operate.
The stream processing job consumes logs from Kafka and performs preprocessing tasks such as:
- format conversion
- deduplication
- record merging
- basic cleansing and standardization
Without this step, downstream anomaly detection tends to be noisy and unreliable.
Build the anomaly detection logic
A robust detection pipeline usually combines several methods instead of relying on only one.
Rule-based matching is the simplest layer. For example, an alert can be triggered when the number of error logs exceeds a configured threshold within a short time window.
Statistical detection adds another level of sensitivity. Moving averages, standard deviation, and similar methods can identify deviations in metrics before they become obvious service failures.
Machine learning models provide a more adaptive approach. Historical logs can be used to train anomaly detection models, including time-series prediction models such as those based on LSTM. As operational feedback accumulates, the model can be tuned continuously to improve results.
For implementation, Python tooling such as scikit-learn or TensorFlow/Keras can be used to build the models, while Spark MLlib can support online inference scenarios.
4. Automated self-healing
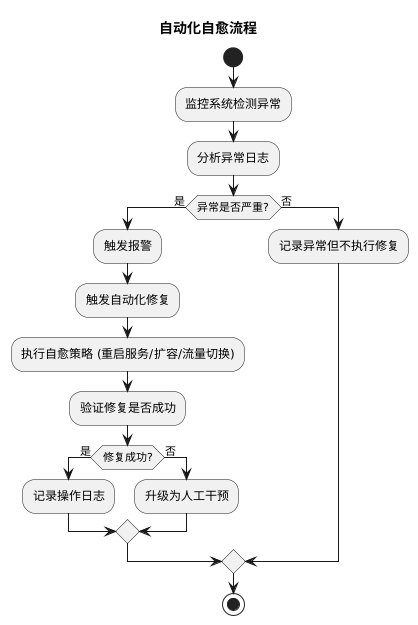
Detection alone is not enough. The real operational value comes from what the system does next.
Define self-healing strategies
Common self-healing actions include:
- Automatic restart: when a service enters an abnormal state, a script or Kubernetes API call restarts the affected container or Pod.
- Elastic scaling: service instance counts are adjusted according to traffic and load, typically through Kubernetes auto-scaling mechanisms.
- Failover: when a node fails, traffic is shifted to a standby node to maintain service continuity.
These strategies should be mapped carefully to specific failure types rather than applied as one-size-fits-all responses.
Integrate operations tooling
To execute self-healing actions safely, the platform needs to connect with existing automation tools.
- CI/CD integration: Jenkins or GitLab CI can be used to run predefined operations tasks when the anomaly detection layer emits an event.
- Automation scripts: Ansible playbooks or Shell scripts can handle recurring operational problems such as cache cleanup or service restart.
- Security and audit controls: every automated action should be logged, and approval and rollback mechanisms should be in place to reduce the risk of a bad automated decision causing a larger outage.
Deployment and validation
Development environment
A local test environment can be assembled with Docker Compose, containerizing components such as Filebeat, Kafka, Elasticsearch, Logstash, and Spark Streaming. Simple test scripts can then simulate log generation and verify that the full pipeline behaves as expected.
Production rollout
In production, the components are better deployed as separate services on Kubernetes. Helm Charts can simplify packaging and deployment.
At this stage, teams need to watch service health closely and tune Kafka and Elasticsearch parameters to match real traffic patterns and storage pressure.
Performance tuning and failure drills
Grafana can be used to watch platform-wide metrics in real time and identify bottlenecks. It is also important to run controlled failure simulations—for example, manually shutting down a node—to confirm that the self-healing logic works under real fault conditions and that recovery time is acceptable.
Common challenges in practice
Building this kind of platform is not just a matter of assembling tools. Several recurring issues usually appear during real deployment.
Data latency and consistency
In distributed systems, there is often unavoidable delay between log generation, collection, transmission, processing, and storage. Buffering and batch strategies need to be designed carefully so that the system stays responsive without compromising consistency too much.
Model accuracy
Early-stage systems often rely on rules or simple statistical methods, but those approaches can produce false positives or miss genuine incidents. Machine learning can improve adaptability, but only if there is enough historical data and a process for continuous tuning.
Risk control in automation
Self-healing must be treated with caution. A wrong automated action can amplify an outage rather than resolve it. Audit trails, approval workflows, and rollback plans are not optional extras—they are a core part of the design.
Resource scheduling and scalability
High-volume log traffic puts real pressure on Kafka and Elasticsearch. Cluster sizing, partition strategy, storage planning, and scheduling policies all need to be thought through in advance.
Practical guidance
A few principles make the rollout far more manageable:
-
Start small
Build a reduced version in a test environment first, validate each module independently, and then expand toward production. -
Treat log quality as foundational
Standardized log formats and careful preprocessing are essential. If the raw data is inconsistent, everything downstream becomes harder. -
Keep improving the detection model
Historical data, operational outcomes, and human feedback should feed continuous retraining and refinement. -
Design safe automation from the beginning
Alerting, logging, approval flows, and rollback mechanisms should be part of the initial implementation, not added after the first incident.
With enough testing, iteration, and operational discipline, this kind of platform can mature into a reliable foundation for large-scale distributed systems—one that not only detects abnormal behavior across the full chain, but also responds fast enough to reduce impact before issues spread.